🇦🇺 (LIMITED TIME $20 FREE BTC) Swyftx, Best Australian Crypto Exchange
🔐 (LIMITED TIME $30 FREE BTC) Crypto Storage w LEDGER
🏆 Free Crypto & Economic Report Emailed To You:
👾 Free TIA Community Discord:
📈 TIA Gann Swing Indicator
🔥 TIA Premium! Trading Courses & Exclusive Community
▶ Subscribe to the channel for more macro market analysis on Bitcoin, Crypto, Stock Markets and Real Estate Cycles.
UP TO $38,755 FREE! Crypto Exchanges
🥇 ByBit Free $30,030 + 0% Maker Fees (NO-KYC)
🥈 Bitget Free $8,725 (US + Global Users NO-KYC)
🇦🇺 Swyftx, Best Australian Crypto Exchange, $20 Free BTC
▶ My Official Socials ◀
YouTube
Instagram
Twitter
▶ My Must-Have Crypto Resources ◀
Education – TIA PREMIUM MEMBERS, Trading Courses & Exclusive Community
Charting – TRADINGVIEW ($30 Off)
Storage – LEDGER
Tax – KOINLY (20% Off)
Trading – TIA GANN SWING INDICATOR
Channel Sponsor: New Brighton Capital, Aussie SMSF specialists. Book your Free consult and use code “Pizzino” for $200 credit off:
This video is for entertainment purposes only. It is not financial advice and is not an endorsement of any provider, product or service. All trading involves risk. Links above include affiliate commission or referrals. I’m part of an affiliate network and I receive compensation from partnering websites. #crypto #bitcoin #cryptonews
Not a day goes by without some sort of Bad news preventing dumb money from Entering the market and I guess that's Why they call it dumb money because it Sits on its hands and waits until the Very last moment before getting into the Market and waiting for that extreme Greed to be placed upon them before they Feel like the time is right remember the Old sayings be fearful when others are Greedy that's the tops and be greedy When others are fearful that is the Bottoms but how do we know when the Bottoms are today's video I want to Continue on with our series of diving Into where the dumb money sits and what It looks like when it comes to news Articles and reporting of analysis and Data it's not a Target at anyone in Particular not them personally just the Data we want to keep it objective here All right guys make sure you have liked And subscribe this is your unique look At the macro Cycles as it continues to Play out and a couple of quick shows to Our Channel sponsors for the Aussies They're doubling the sign up bonuses There from 10 to 20 bucks of free BTC And for everyone Ledger is giving away Up to 30 bucks when you purchase their Ledger Nano X or 20 bucks of Bitcoin When you get the Nano s some pretty good Specials there they don't do it often so If you are in this in the market to get
A ledger to protect your cryptocurrency Check out the link in the top of the Video description Now let's start with this chart right Here we have been following the Presidential cycle looking at how the Market gets returns in the year prior to The election year where in 2023 this is The year prior to the election year the US presidency is up for election again Next year in 2024 and this going back Into 1932 90 years of data now we can start To add some more of that data to the Presidential cycle shows that from October 1st of year two so that's last Year 2022 to the 30th of April which Leaves us 23 days to go The average has been about 27 or so Percent it's obviously above 25 or below 30. so it has some pretty good gains During that seven month period of October 1st to April 30th so the really Interesting part now is where do we sit Where do we sit for the s p this is the End of September here on the weekly Chart and there's the start of October You can see what my curse is pointing 27 Up brings us to about 4 500 points where We currently sit to the close of this Week is it about 14 and a half percent So about halfway to that average point Now of course it doesn't mean that we Have to get to that average point we
Could be a little lower we could be a Little higher but so far from the Presidential cycle itself which is Something that we've been talking about For months on end now on the channel Looking at the s p especially after a Bear Market This does tend to work out like it says It's not a hundred percent every single Time you'll get these these readings but There is even a higher chance of getting A positive return If the prior year the 2022 the second Year of the presidential cycle was a Bear Market year it was a down year Because you're going to get bigger gains From the low but remember the lows are The most difficult time to be entering The market it's when everyone is fearful Telling us why things should be blowing Up why there is the biggest failures of All time why this is only just starting Why it's only going to get worse while You shouldn't be getting into the market So on and so forth so I'm just Exaggerating that because of how long We've been hearing it for at least 12 Months you know from those peaks of 2022 We had that first drop off and then into The next Peaks and of course we heard it All before that but yes there are still Some people who believe that there is Worse to come now I just want to break Down some of the data that we see like
In yesterday's video in previous videos As well like I said this is not a Target At anyone in particular and I want to Hear from you guys in the comments Section is this helpful for you you want To see more of it because I know that I Do use some particular accounts and I Don't want to have a go at just the same Ones I know some people usually get Triggered at that but anyway we're just Looking at the data here and these sort Of things is what was very common in March when the banks went down this is Going to be the same thing that we'll See whenever some big news comes out Next week or the month after or the week After that it happens every single time So history of bank failures it's showing Us a chart Of the bank values in terms of their Dollar values of course The dollar values are going to be Increasing they're showing here that It's getting bigger and bigger and Bigger so using the word bigger is Obviously more scary in yikes are in Play there but Of course it's going to be bigger there Is more money in the system it's always Going to be a bigger collapse whenever We do get a collapse then the previous Collapse it's going to be the biggest Collapse that the world has ever seen Whenever that collapse occurs because
They're going to measure it in dollars And we have more dollars at Play It's pretty simple that's that's as Simple as I can make it to dismantle This fear here not only that but of Course that was the fear there in March And there's the low bouncing beautifully Of some support and now we've moved a Few hundred points away from that low so Not only is the reading of this analysis Incorrect it's also preventing dumb Money or people on the sidelines sitting On their hands with money waiting to get Into the market it's preventing them From entering the market because they Believe there is much worse to come yet The the markets the charts the facts the Data whatever you want to call it is Showing it's the opposite we had a low In October we had a low in December we Had another low in March at some of the Most fearful extreme times and now the Market has pushed away granted we are Coming up to resistance again at 41.50 And there is the potential to you know Push down from this point remember we've Still got this significant lower play The possibility of the cycle low that October low in 2022 this low is still in Place so no matter what happens from This point if the market cannot break That low we are basically putting in a Bottoming process a transitional period If you will going from a bear Market to
A bull market if the bear Market is to Continue it must break this low it has To break down it's no good just going From where we are and moving down five Percent or ten percent it has to break That low and get past a 15 loss from This current point that is a Continuation of the bear Market but for Now we're putting in high highs and Higher lows within a range that has been Set for nearly 12 months we're winning Our 11th month now it started back in May of 2022. So going on from this you can just see More and more data to basically spread The fear that there is further to come And this is essentially it's no hit at Any one in particular it's just what the Market also wants to see as you can see A lot of viewers want to see this sort Of information coming at them the fear Just amplifies the fear further and Basically paralyzes you from doing Anything in the market so it goes on and On and on why things are worse than what They uh really are and then what we've Seen from that point is property prices Have begun to turn so this time when Everyone was paralyzed with the gains Not as high as what they were once were During that pandemic pump and we started To see gains go into the negatives so Losses negative one we've now seen a Higher low and the markets have begun to
Turn we're starting to see a positive Result in property prices albeit it's Quite short at this point in time There's they're not huge gains but I Would not be expecting that from the low Prices that's idiotic it those sort of Gains usually happen towards the end of The cycle think about what we see in Cryptocurrency Bitcoin and all coins These things go stupid at the tops of The markets because everyone is piling In because they are less fearful they're More greedy they are feeling comfortable Because everyone else is in the market But just like a game of musical chairs Once everyone's in who's left to take The bait who is left basically like a Ponzi scheme rather than musical chairs But essentially like a Ponzi scheme if Everyone is into the market there's no One left to buy and that's when Things Fall over not at the bottoms when there Is a load of people sitting on the Sidelines waiting to get in it's the Opposite that's what we're told to do We're always told to do the other when In fact we have to go against our Emotions at times and the hard part is Figuring out when those exact times are Because the emotions are fearful all the Way down but how do you know when the Bottom is we use multiple signals here Which is why I suggest liking and Subscribing to the channel and share it
With a friend if you're finding some Great value from it I do see your Comments down here so thank you very Much guys and uh just letting me know What your thoughts are when it comes to The analysis on the Channel all right so The dollar the US dollar also starting To fall again this is obviously going to Be pretty good for assets like Bitcoins And your Commodities are also going up We can see oil is up to 80 bucks gold is Over two thousand dollars now silver Over 25 an ounce the things that it's Not good for is gas because gas has gone Down 80 and it did already have its blow Off tops here where the media was trying To Hype us up telling us that the world Was over people couldn't afford anything Because the gas price is going to be too High and they're all going to freeze etc Etc it's the same thing again when it Comes to the news headlines we had the Breakdown and now we're basically Testing the lows again so Overall as I struggle here with my my Voice the US dollar is down and this is Good for the s p it's good for our stock Markets it's good for Real Estate it's Good for cryptocurrency and so we expect This to continue down over the coming Years as we lead into the peak so I'm Not oblivious to what is going on out There when it comes to the economy and The ridiculous stuff that the FED does
Pumping more money into the markets this Is going to eventually explode at some Point the problem is try to understand When that time is and what we're seeing On the charts is that it's not time just Yet so let's continue to stick with These charts we'll continue to follow up With the presidential cycle and just see How much uh return it was actually put In this time round as we see it's Currently up to 14 and a half percent And the average is around 27 what does This mean for BTC the fear and greed and What's going on over there well of Course if the s p continues to go up There is less fear out in the market and The uh the other assets like Bitcoin and Crypto they can continue to pump as well Now we just had a rollover of the data Here uh it's 10 AM for me so this is the New data here but in terms of the fear And greed for crypto this is our Proprietary indicator that we have for Tia if you want to get access to these Sorts of things go over to the top of The video description and there'll be a Link there to subscribe to our crypto And economic report so we'll have some Details there if you subscribe to that BTC holding up you can see that the fear Has continued to lessen and the greed Has continued to increase even while We're at at the lows in the market Through June to November so we had this
Period here before we had that final Dump into November and December and that Was the time As you can see that was a time where the Fear was the most extreme then the fear Became less so the the greed started to Enter wasn't necessarily agreed it just Wasn't as much fear in the market and Then we had the banking collapse right Here and the market is now well and Truly above that point so we're well and Truly above the lows can we revisit These levels here potentially but for Now we're still above uh 28 000 sitting Around that level there and our previous Support or the previous resistance which Could become support if we do get a Little a little bit of a pullback is Around the 25k level so just like I Pointed out with the S P 500 no matter If we have a few percentage point Pullback it really has to get quite far Down to take out any of those Significant lows to have an attempt at Taking out the next low so these are the Most fearful times as the fear and green Index shows us but they're the less Risky time the least risky times Because they are so far down already From the highs and the fear is at its Most extreme in the market and it has to Do some pretty severe pushing to the Downside if it's able to break through The previous fear of the market there
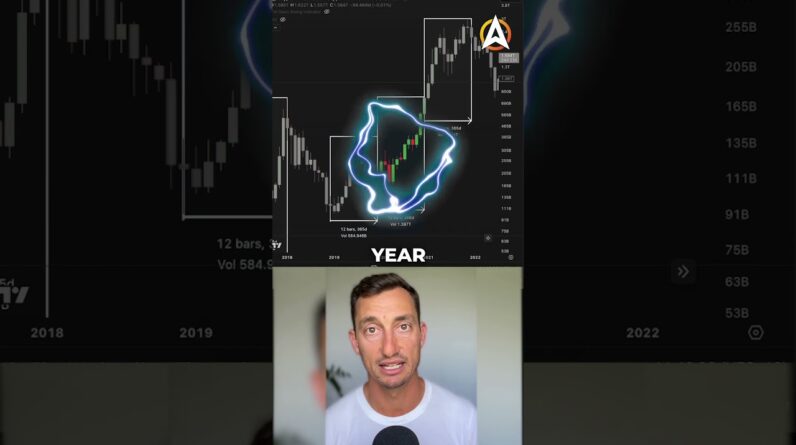
Aren't too many indicators out there That give you an almost 100 accurate Reading and I don't ever want to be Using any indicators that are 100 Accurate because it just doesn't exist In trading or or investing and if you're Told there is something that never ever Fails run away run the opposite Direction everything will fail in the End all of these models that run Bitcoin Up to a million dollars or half a Million or whatever it is 100 000 they Will all fail in the end so I take this With a grain of salt but what we have Seen from the mvrv score here is once Bitcoin breaks out of the Zone down here It doesn't come back and test it until The next bear Market bottom you've got The breakout bear Market bottom there Was a slight test With the covered dump There's a Max bull market top and then We have the next bottom so what could Happen in the future is that we don't Reach this this lower Zone here which is A good buying opportunity in the market Maybe we head up and then it comes back Into a shallow dip And then starts to move away again so It's not the greatest these sort of Models will always break but for now What we've seen in the past is that once We break out of this Zone we don't come Back to it so just adding to my thoughts
Around is now the least risky time most Likely the least risky is being in this Zone here but as soon as we start to Break out we rarely come back and test It you can see once in 2015 2016 it Dumped into it broke out came back under And in previous times there was a little Touch here but this is way before any of The data but just going forward from This point we're just starting to creep Out of this Zone and often we don't come Back to it so it could still be a Reasonable time even if Bitcoin comes Back to test 25 tab you know it's 10 Down from where it currently is that's Crypto we've got to get used to those Sorts of swings doesn't mean it has to Happen but for now this is at least what The the data is showing from the MV RV Score as well so I hope that was able to Put some of the news head lines into Perspective for you let me know in the Comments section if you want to see more Of that I certainly enjoy presenting That because it allows me to assess the Data take a look at what other people Are analyzing and seeing if it is Actually true or false based on what the Market data is actually giving us based On what people are actually doing in the Markets what investors are actually Doing in the markets rather than reading Those headlines and trying to blow them Up as big as possible like subscribe
Bell notification icon have a fantastic Easter I'll see you guys back here at The next video don't forget our Channel Sponsors swiftx and Ledger if you want To get up to 30 bucks of Bitcoin for Free catch you back here in the next one Till then peace out