🏆 Free Crypto & Economic Report Emailed To You:
🟠 (FREE $100 USDT FOR SUBSCRIBERS) Bitget Free $8,725 (US + Global Users NO-KYC)
🔥 TIA Premium! Trading Courses & Exclusive Community
🇦🇺 (LIMITED TIME $20 FREE BTC) Swyftx, Best Australian Crypto Exchange
👾 Free TIA Community Discord:
📈 TIA Gann Swing Indicator
🔐 Crypto Storage w LEDGER
🟠 (FREE 100 USDT FOR SUBSCRIBERS) Bitget Free $8,725 (US + Global Users NO-KYC)
▶ Subscribe to the channel for more macro market analysis on Bitcoin, Crypto, Stock Markets and Real Estate Cycles.
UP TO $38,755 FREE! Crypto Exchanges
🥇 ByBit Free $30,030 + 0% Maker Fees (NO-KYC)
🥈 Bitget Free $8,725 (US + Global Users NO-KYC)
🇦🇺 Swyftx, Best Australian Crypto Exchange, $20 Free BTC
▶ My Official Socials ◀
YouTube
Instagram
Twitter
▶ My Must-Have Crypto Resources ◀
Education – TIA PREMIUM MEMBERS, Trading Courses & Exclusive Community
Charting – TRADINGVIEW ($30 Off)
Storage – LEDGER
Tax – KOINLY (20% Off)
Trading – TIA GANN SWING INDICATOR
This video is for entertainment purposes only. It is not financial advice and is not an endorsement of any provider, product or service. All trading involves risk. Links above include affiliate commission or referrals. I’m part of an affiliate network and I receive compensation from partnering websites. #crypto #bitcoin #cryptonews
Over the last 24 hours Bitcoin has Dropped a massive 5.3 percent sending Shock waves through the altcoin season Hopefuls so has the market priced in a Recession or is this the beginnings of That recession before you get on your High horse no I haven't switched camps But I do want to go through all of the Data give you the facts on the charts And interpret the data the best way I Know how as we incorporate all of that Information out there Skim off the noise of the mass media and Bring it all together in our 18.60 of Real estate and economic cycle this is The only place that the internet that Gets you through the macro Cycles Looking at a holistic picture of the Investment space and if you want further Details on that what YouTube video is in A YouTube video if you don't go to the Links in the video description click on This one here that's our trading course And exclusive Community that'll give you Access to our Discord over here so this Is the paid Discord up here with tons of Exclusive content like our courses that Go through everything from a beginner to An advanced investor and Trader hours And hours of content structured for you And master classes that go through in Detail around investing and trading as Well some of the stuff that you just Won't find anywhere else is all in here
Alright guys After you've liked and subscribed let's Have a look at what's happening with Bitcoin right now as we head towards the Close of the market I've had this up Here for a couple of days we want to see The price out of here for the balls to Continue on but remember time frames Eventually run out we've been up since The November low coming into this April Top so roughly five months now you have To expect that we get some sort of Pullback now we have two areas here I've Just drawn in our red line across here Horizontally at around that 28 400. it Becomes a little clearer when we have a Look at the candle so you can see the Bodies and the Wicks essentially that's The upper range here of where these Bodies have been closing for the day Somewhere around that 28 3 to 28 4. Ideally you don't want to see Consolidation under this level and Hopefully we don't want to see the Market close for too many days below This yellow line at the top here which Is that top of the previous range and That price was 29 190. so so far it looks like today will By the time this goes out you'll know The answer to that probably going to Close under this Zone but we know that We can have fake outs of course there's Some fake out to the downside maybe
Eventually closes above but nonetheless Worst case scenario if Bitcoin is to Remain under this level ideally you Don't want to see it go past the low Here and that low of the range is still 26 500 of course the next levels that Many people are waiting for and hoping That the market pulls back to is the Highs that were set in August of 2022 Which was a double top into February of 2023 basically an exact six month period Of those tops to Tops but I'm still in The macro boot camp even though it can Be short-term bearish the macro Bulls or At least the I guess long-term bears are Hoping for a price pullback below 25k And below the levels here at around 22 000 they want to see the market come Back under 20. you see those comments All the time I think a lot of these People are going to find that it was a Missed opportunity now of course I can Say that and if it happens to come back There we will revisit this if it does so Make sure you take your screenshots and Your audio recordings but I have a Pretty strong feeling that this is not Going to happen they're not going to see Underneath these levels you can see There was support there was quick Breakdown over extreme news that was the Biggest news that we have seen this year In 2023 with the banking crisis and that That is what these three days are right
Here the market quickly got back above Those levels on some pretty solid volume So I think the people who are now Waiting for prices underneath 21 300 I've been calling it around 22 000 Are going to be very very sad when the Market never gets back to that point and I see that as a missed opportunity and Those guys are going to continue on with Their missed opportunities as the market Pulls back because if they didn't buy it On the most extreme news getting to Nineteen and a half thousand dollars uh What makes you think that they're going To buy it now when we get into any sort Of zones here at 25 or 26 or 27 000 it's Probably not going to happen mentally Speaking here so the market pulling back Also coincides with the fear and greed Index the last couple of days we saw a Peak at 69 and that essentially was the Level that we're expecting some sort of Resistance remember we're looking at Between 60 and 80 on the fear and greed To a nice solid line through the 70s and We're starting to get some resistance Here the other thing I mentioned about This resistance was that we would start To get some volatility between the Emotions going from that high greed down To the neutral maybe even into the fear Just like what happened during the 2019 Period when the market pulled out of the Accumulation range as the market climbs
Higher you do start to get bigger and Bigger swings between the emotions Because you've got the Bulls Unsure how Long this move has going to last and Then you've got the Bears so hopeful That they're going to get their lower Prices all those prices that they missed Out on before if that ever got back Anywhere close to it you'd have to bet That the majority people are going to Want to pre-run that level and start Buying up at 23 or 24 or 25 you just Can't see it happening because of how Badly a lot of people missed out on Those levels which is bringing me to the Topic of the video which is around the Recession and how the recession has Probably been priced in already so this Idea comes from a great tweet here from Seth you guys know I've posted about him Before there has been three times in History where we've seen recessions with Positive S P 500 returns we need to Understand this because of course that's What everyone is leaning towards with Bitcoin they're waiting on a recession They're waiting for the stock market to Collapse but it doesn't seem like it's Happening I'm talking about a collapse Breaking the cycle lows not just a few Days down or breaking five or so percent At the downside for the s p I'm talking About taking out the lows that is what Has to happen if this is actually a bull
Trap to the upside more than likely not Going to happen so there's three times In history where the market has gone up During a recession now I'm not even Saying that we are in a recession we've Had a technical recession when the GDP Went negative for two straight quarters But we're talking about a recession here When it's actually called the end of the Day like I've talked about many times Before hopefully you're starting to get The hang of it it doesn't matter about The word recession what matters is can You trade the market can you buy low and Sell highs it's all that matters if the Word recession is called as the Market's Going up How are you going to make money you have To make money by buying and then Eventually selling when the Market's Higher so it's showing up three times in History that we've seen some pretty Negative periods of uh growth here so We've got 1949 where these gray areas You can tell here from the chart are Recessions you can see through here 1949 And so on 54 57 60 and the other one We're interested in is 1980 here and of Course the last one we had was in 2020 Just for a uh one quarter but going back To 1949 we had a recession but on the Chart 1949 was essentially an up year into 1950 so although a recession was going
On the market continued up and some Might ask well how the hell did that Happen and why doesn't anyone ever talk About this I suspect no one talks about It or at least the media heads don't Talk about it it's because they try to Work their analysis into their own Beliefs of the market rather than Focusing on what the actual data was and How that is likely to rhyme in the Future the next thing they do is say That this time is different there's so Many things that are different Quantitative easing 300 trillion this That the other it's always the case and People will always say this time is Different once you stay in the market Long enough you start to realize that It's not necessarily different it Rhymes And there are a lot of similarities and Timing always plays out time and time Again because humans are basically a lot Of us are smart but a lot of us are Pretty freaking stupid and they just Don't want to learn from the past that's Why we can continue to forecast the Cycles because as much as people are Smart they just don't want to see what's Already in front of them so I've got my Little rant out over how the mass media Always misses the mark and there are Always two steps behind this is Basically showing us what's happening Next it's basically a tweet that I've
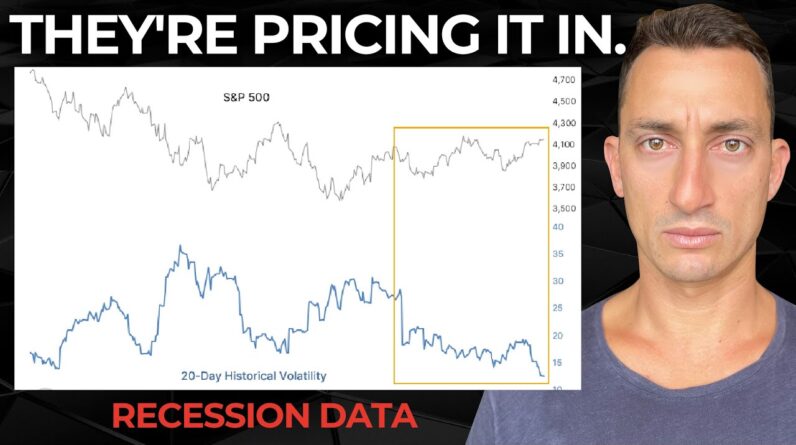
Got here go check out the links in the Description like And subscribe you know That good stuff down there follow us There so you can see these tweets come Out out now you'll notice and it's Something I've talked about almost every Single video The bearish Narrative will Continue to shift what are what we have Been hearing is their commercial real Estate is collapsing then they start to Swing back to the earning Seasons so I Think we're going to start to see Something around earnings again earnings Are missing yada yada it's always the Case the narrative always shifts while The Market's going up because they can't They can't figure out why the Market's Going up while all of the signs are down It's because the recession has probably Already been priced in I'm saying Probably I don't have a crystal ball but I do have history to help me forecast The future so what's actually happening Now s p is up 19 from the cycle low of October NASDAQ October low up 25 Dow Jones up 18 from the October low the vix Is at new lows which we'll have a look At as well and it continues to drop so As the vix continues to drop that may Remains the volatility is dropping and It looks like we're heading further into The start of a bull market I did see Some comments from people saying they Don't believe this is the case and
They're only starting to see it hit Support I don't know what to tell you Everything has been pointing to this Since October and I've been banging on About it for six months now God help you Okay moving on home builders ETFs up 35 From the cycle low they're doing well China's up 20 from the low Japan's up 16 From the low the French Market hit new All-time highs again UK 1.8 from an All-time high Germany 2.4 from an All-time high Australia 3.6 from an All-time high and of course Bitcoin up Around 88 from the cycle low but of Course if it is dropping you have to Just go and measure that at the moment Because it's always quite volatile so The fact remains that the bearish Narratives are running out of steam and We are going to continue getting hit With something left right and Center Next it might be regulations and next it Might be an SEC thing hopefully starting To see that the majority of the news Pieces right now and nothing burgers and What happens when the news of bearish News can't affect the market You guessed it but probably in a bull Market so once we start to see some of The bullish headlines come through which Might not be till the end of the year or 2024 it's probably a huge huge huge Missed Opportunity by those Bears who Are waiting on their hands to buy
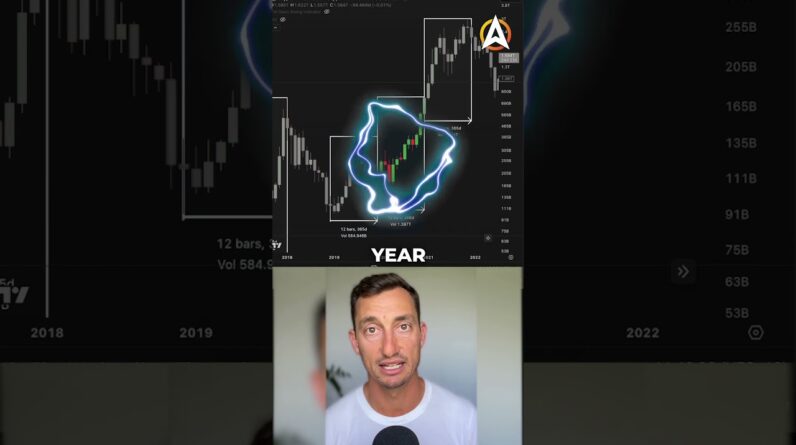
Underneath the previous support levels And this solid support level is Basically beginning to form at around 3 800 points before it was the 3500 low in October then it was around 3 600 points And now we're putting in those lows at 3 800 which was that banking crisis low The market yes is grinding up style like Coming into a resistance level so short Term sure it is possible that we see Some downside but keep an eye on those Shorter term resistance and support Levels at around 4 000 points at 4 000 Points It's also roughly the 50 level between Where the current top is and the cycle While this short term low so there's 4 000 and then these other bottoms here Which were tops around forty four Thousand and sixty six points so keeping On that for the s p this is all going to Help out with BTC Back to BTC before we uh head over to Some of the data there With BTC right now this doesn't mean if This is the case where we drop into this This box this doesn't mean that we have To play out exactly what happened in 2019 where the market collapsed 50 we're At 31 000 is the top what if 2015 2016 plays out where we just trade Around in this range for the next couple Of months that's also the possibility
Here where we just sit between 26 and Maybe these upper levels here at around 28 29 000. it could be a similar pattern To what happened in late 2015 and the First half of 2016. you can see we had This pretty good move up from the lows The market did quickly fall we haven't Seen a big spike like that so I doubt We're going to see a big crash like it Did in 2015 typically you get big spikes And big crashes but if it just grinds up Maybe we just grind down with a few Quick liquidity grabs to the downside But basically what Bitcoin did back then Was hold above the previous accumulation Zone and then start to put in higher And higher And higher lows before it eventually Broke out and each of these occasions You can bet your bottom dollar that the Bears were waiting for the market to Drop back to the previous top they had One opportunity here Market ran up they Had another opportunity to buy slightly Higher they didn't want it they had Another opportunity to buy slightly Higher again They didn't want it another opportunity They didn't want it and eventually time Runs out and history repeats Market runs Up and so they keep waiting for the Market to reach their previous support Levels that they want and it just Doesn't happen so keep an eye on that
Should we continue moving forward and Maybe we only get some sort of sideways Period that ranges something like the Past maybe it's a 30 or a 40 range from That low as always if you're finding Value from the content why not check out Our free crypto and economic report but If you want more than that you want the Structured education around investing in Crypto stocks and real estate check out Tia premium link is in the top of the Video description that's where you get All of this structured content hours and Hours of it going through trading plans Investing plans and massive master Classes as well with a lot of detailed Information over there all right so that Leads me to some of the data here about The volatility we're seeing the Volatility drop off without too much of A grind to the upside what this drastic Drop in volatility it can mean is that It could be just a mostly positive sign In the long term one two one week to two Months after we get the signal of 90 Days change in the S and P 500 and a Drop in the volatility so a significant Drop in the volatility with a short Upside move in the s p is that these Shorter periods you don't get too much Of a good change here 0.8 down to one Negative one percent but moving forward 3 6 12 months later you do get some Pretty good upside remember though the
Market is already up 19 And so measuring these things from the Particular period right now adding that To this number is a much healthier Percentage move which is why I talk About the missed opportunity from the Bears who have missed out on this 19 Move on the S P 500 and of course the 80 To 90 percent move on bitcoin while they Wait for a mega collapse probably not Going to happen based on what we've seen In history of nearly 90 years just over 90 years of data here the vix also Collapsing again which is a good sign For the S P 500 these are levels that we Have not seen since the bull market top In January 2022 so this is the first Time we have reached these levels again Great sign for the market quietening Down and just starting its slow Grime to The upside this is the way bottoms are Formed because everyone is still quite Bearish and you just start to see these Slow grinds out hit that like And Subscribe let me know you're still here At the end of the video by dropping me a Little up chart Emoji all right last Piece of the puzzle the 18.6 year real Estate and economic cycle I do think There is a big collapse coming but it's Probably a few years off now it all Works in with the recession data that we Have looked at as well we are going to Get a massive massive recession but it's
Not for a little while longer there's Not much time left this bull market is Quite old because it started back in 2009 through the 2012 as we can see here At the low so the real estate cycle and For the stock market was 2009 So Eventually this does come to an end and We're getting there but we still have a Nice big boom to go because this is Where everyone gets super excited they Throw all the rest of their money that They've got left in the markets into it And then we collapse just like an Altcoin season or a big Bitcoin bull Market which I still think is to come Like And subscribe let me know in the Comments section that you're still here At the end drop us a up chart check out The links in the top of the video Description still some limited time There for Aussie viewers who want to get Doubling of their free Bitcoin and Bitcoin uh bit get there as well giving Away free usdt using our Link in the Video description thanks again guys I'll See you at the next one till then peace Out