🏆 Free Crypto & Economic Report Emailed To You!
📈 TIA Gann Swing Indicator
🔐 Crypto Storage LEDGER
🔥 Become a TIA Premium Member! Trading Courses & Exclusive Community
▶ Subscribe to the channel for more macro market analysis on Bitcoin, Crypto, Stock Markets and Real Estate Cycles.
Channel Sponsor: New Brighton Capital are Crypto Accounting Specialists for Aussie Self-Managed Super Funds. Book in your FREE consult and remember to use promo code “Pizzino” for a $200 credit off your SMSF accounting fees. https://newbrightoncapital.com
UP TO $48,755 FREE! Crypto Exchanges
🥇 ByBit Free $30,030 + 0% Maker Fees (NO-KYC)
🥈 Bitget Free $8,725 (US + Global Users NO-KYC)
🥉 OKX Bonuses $10,000 (US + Global Users No-KYC)
🇦🇺 Swyftx, Best Australian Crypto Exchange
▶ My Official Socials ◀
YouTube
Instagram
Twitter
▶ My Must-Have Crypto Resources ◀
Education – TIA PREMIUM MEMBERS, Trading Courses & Exclusive Community
Charting – TRADINGVIEW ($30 Off)
Storage – LEDGER
Tax – KOINLY (20% Off)
Trading – TIA GANN SWING INDICATOR
This video is for entertainment purposes only. It is not financial advice and is not an endorsement of any provider, product or service. All trading involves risk. Links above include affiliate commission or referrals. I’m part of an affiliate network and I receive compensation from partnering websites. #crypto #bitcoin #cryptonews
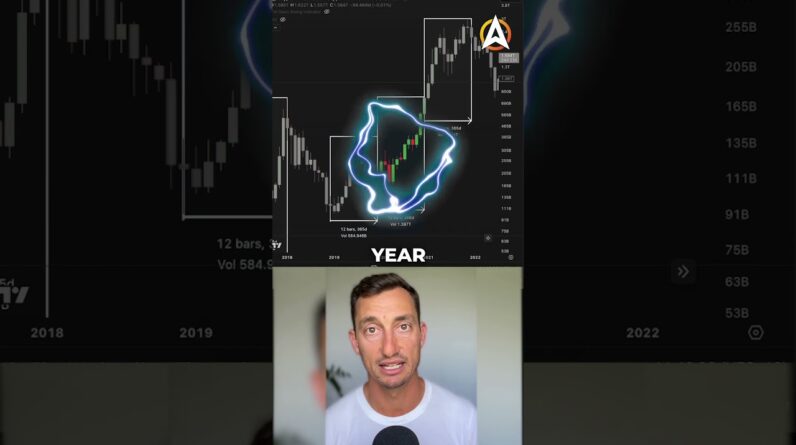
The S P 500 is approaching five months From its current cycle low it's up Nearly 16 from that low in October of 2022. overall we've been in this trading Range for just over 10 months meaning The market has not dropped below Critical key support levels of 3 500 Points for the s p however these are Some of the most difficult and Challenging times for investors it's What's potentially known as a Transitional period between bears and Bulls now that does get a lot of people Off site quite quickly so maybe I'm Shooting myself in the foot here by Mentioning at the beginning of the video However I just want to show you some of The data from the other side of the camp And you make up your own decision Throughout the video I'll let you know My opinion mostly at the end of the Video sometimes throughout but this is a Look at the possibility of this area in The market being a macro low forming Before we start to head to new highs for The air s p potentially for the NASDAQ For cryptocurrencies and most Importantly for Real Estate if you Haven't left yet make sure you like Subscribe follow the journey along this Is what we have been looking at since These June lows looking at a macro Bottom formation on the s p and Bitcoin As well when there's so much negativity
Out in the world especially trying to Creep into the news narratives it is Very tough to listen to something else So I do appreciate your support on the Channel and if you do find it valuable Share it with a friend it does go a long Way to supporting and helping out the Channel first up I want to look at some Of the major news items that are coming Out this week you can see the red the High impact news announcements are these Red icons here this is Friday evening my Time and Friday morning for the us we're Looking at non-farm employment change Basically the jobs that are coming out In the US we're currently at historic Lowest levels of unemployment basically Seen since 9 1969 sitting around 3.4 percent the news will tell us one Thing the market will react a different Way but essentially what we've seen last Time was a forecast of 193 000 jobs and That an actual reading was there was 517 000 jobs that came out some would argue That this is a bad reading for the Market and from the third of February we Saw a decline into the current low of The second of March however when we look At the broader picture not just the Day-to-day analysis we are definitely Seeing higher lows forming in the market And this one isn't 100 confirmed yet but We do have the October low here and then The December low as well we're also
Seeing higher highs continue to form in The market off the back of data which Can be read as negative but we're just Seeing the opposite happen in the actual Charts themselves and if we start to Break through 4 200 points this is Really going to start to set things in Motion for the macro bull play to come In where the news essentially flips to Talk about things in more of a bullish Light rather than a bearish light that's A subjectivity of how the news is Interpreted the chart the data the Objectivity is showing higher highs and Higher lows that can't be argued with Which basically means investors are Coming in to buy the market up at higher And higher prices every time the market Comes back down with increasing interest Rates there have been fears around Consumers not being able to meet their Mortgage obligations obviously the Interest rates have increased quite Dramatically quite quickly but when we Look at the longer term data here 99 of Outstanding mortgages have interest Rates below pmms American homeowners can Get longer mortgages unlike what we have Here in Australia one three five years Whereas you actually get up to 30 years In some cases and in this case that Would mean that they are insulated from Any of the FED hate rate hikes because They're not going to expand experiences
Until their mortgages come due so Although there's a negative sentiment Here around 99 of current mortgages have Interest rates below the current market Rate the majority of these won't see any Interest rate rise for many decades to Come because they had locked in for Long-term mortgages often what follows From The increased interest rates and The hardship from mortgages that are Expected to come even though many of the Mortgages are locked in for much longer Terms we start to see that consumers are Drawing down on their excess savings so This starts to spread more fear to the Market as well the main thing to note Here is that the excess savings rate is Still in the positive although it is Getting drawn out quite quickly quickly It's still in the positive and these can Turn into the negative yet the market Continue to go up this is such a short Look at the entire Market that it Doesn't really bring enough information However when we take a look at the Personal savings rate we can see that This is starting to creep up it has been At some very very low levels you can see In June it was only 2.7 percent of Personal savings now it's creeping up to 4.7 so we're starting to move back into That positive space so we're starting to Move away from that low of 2.7 percent And this really doesn't mean anything to
The current market conditions you can See historically this has moved down From 10 to 15 percent all the way down To below five percent and we can see Underneath these levels of five percent Was basically the top of the market but That lasted for many years so it's more So a shift in how people choose to use Their money unfortunately in my belief We should have more savings than 4.7 in Our accounts but that's my opinion in Terms of the data here it doesn't Necessarily make a low reading here mean That the market Should Crash just Because the everyday consumer has less Savings Consumer loans credit cards Other revolving plans is also pointed to As being at historic high levels with Credit cards being again at historic High levels around 19 or 20 percent per Annum now this is going to always run Into all-time high territory because Money is continuing to get printed the Population continues to increase Inflation continues to increase Therefore these numbers will also Increase and so when this is pointed to As being a negative to the market Basically macro bearishness we're at the Highest levels of debt we have ever seen In history and credit cards are at their Highest levels It doesn't mean that the market needs to Crash because this is always going to
Run up just like the stock markets Continue to always run up because of Inflation the money printer continues to Inflate the market yes it's turned off For the time being but over the long Term this number will always go up but Rather than reading this as a negative Sentiment it almost seems bullish you Can see the Peaks here in late 2002 Early 2003 that was the bottom of The.com Crash you can see we went Sideways basically sitting around 240 Billion quick sharp rise and this was The bull market into 2007 around the peak of the GFC this Continued to run up into the low and Then quickly dropped off before a spike Obviously the FED started to print again More money went into people's accounts And this continued to rise through their Next bull market from bottom of 2009 to The peak of early 2020 it dropped off And started to run rise again so one Might say that this is actually the Opposite once we start to see a rise in Consumer loans and credit cards that Leads to another bull market as it has Done in history once as it is done in History twice as it has or potentially Will do in history three times that of Course is after a sharp decline yes We've seen a pause here and a slight Decline a sharp decline another sharp Decline so I'll leave it up to you this
Is the way I'm interpreting this data I Want to hear from you guys in the Comments section now this is where Things get extremely misleading interest Rate Rises fed pivots lead to Market Collapses Entirely untrue let's take a look at it From the charts and more historic data From the fed the federal fundings funds Effective rate so taking a look at this We have a Fed pivot 69 73 81 2000 2007 2019 2023 however it misses multiple Times throughout this cycle and other Times where the market was already Trending down from that point case in Point we can see from the 80s we have a Peak here Market trending up then a Collapse in interest rates or effective Rate Market went up Market rates went up Again Fed pivots Market Moves up again after of course the Black Monday here which was a very quick 50 Dump and the market started to climb Very very quickly from that point again Here is another pivot Market runs up in Interest rates to this peak here in the 90s Market continues up all the way into That Peak so potentially over five years Here this is a pivot this is something That could happen now remember we are Only at a move up from zero which is Historically extremely low yet during This period which everyone forgets the
Market interest rate was heading down Plateauing down and then a sharp rise Into the end of that cycle before we had The market collapse again Market was Creeping up and rising in interest rates For years plateauing for a period of Time and then the collapse happened from That point same thing again interest Rate rising Rising rising and a plateau So so although the FED pivoting has Looked like we've seen the market Collapse from that point it can be many Years before we do get a collapse the Market can actually even turn so I think It comes down to what the opinion is When it is said that the FED is pivoting On interest rates is it one drop in the Interest rate is it multiple drops is it Multiple drops over a long period of Time is it multiple drops very very Quickly like in these cases but what About this case what about this case What about some of these other cases Through here that's in the late 70s Early 80s where the market continued to Go up even after very sharp drops and Then rises again that occasion in the Late 70s early 80s was from 17 down to Nine percent up again to 19 Down to 14 so there was a lot of twoing And throwing within the interest rates Interest rate Rises through the 60s mid 60s late 60s and then a drop interest Rate rises again into the late 60s and
Then an interest rate drop of course These gray lines are the recessions here But we had many times where the FED had Pivoted and the market continued to move Up from that point without totally Collapsing the market until it was time In the cycle for it to collapse so Really what this is telling us is that The interest rates can increase and the Market still increase interest rates can Go down and the markets still increase Interest rates can Plateau the market Can still increase take your pick if you Find Value from the content don't forget To like And subscribe to the channel if You feel up for it share it with a Friend this is a sort of macro stuff That we go through with our premium Members for our trading and investment Portfolios looking at how the market Could be interpreted in multiple Different ways so that we can then make The best case decision for our own Investment portfolios something else That is also looking like it's quite Bullish is new stocks were reaching new Recent highs so this is the U.S HL us New highs new lows index throughout 2021 We saw a lot of stocks reaching new Highs throughout 2022 we saw them Reaching new lows now in the early part Of 2023 we're starting to see a lot of These stocks start to reach new highs Again this typically happens in Bull
Markets because of course if stocks are Reaching new highs then the index itself Is going to be pushing to higher prices If they're reaching lower prices on the Stocks of course that's going to push The index itself to to lower prices as Well and we saw the most extreme lows Throughout 2022 happened around May and Then get a little less in June which is A significant low if you could see here This is June this is May and then again We had that final low here September and October so on this reading here you Could see October is September and October is the main points where that Final low for the stocks have come in Now we start to climb out of these slums Into some higher prices it's not at These levels that we saw in early 2021 Or even late 2021 when we've got that Final Peak but we're starting to creep Into that zone again now after all that Info we come back to check the charts This is the final answer this is the Data that is given to us by the markets Because this is where the investors are Buying and selling they're showing us They're buying up at higher and higher Prices every time the market falls on The back of some of these bearish news Narratives now we look at the lows here At dead on 50 of the macro range you can See the pandemic low the early 2022 or Late 2021 top the market fell dead on to
50 of that level that's why the 50 level Is so important yes some other analysts Will use the 61 and a 38 but as again Analysts we focus a lot on the 50 level As the markets tend to respect this low Level quite heavily on the macro and the Micro so looking at the micro you can See the downtrend basically the bear Market the market had bounced off the 50 And has now been rejected at the medium 50 right here at 41.55 so basically the 4200 level is going to be a key level For the s p to overcome to get back into That more bullish state so from that Rejection at 50 we've then come back and Just ticked a little under this micro 50 Level which brings up a new even more Micro 50 level looking at the daily year Going up to around 4060 and we could Look at some of these tops here and here At around that 4080 4100 level so we Want to see in the short term dailies Maybe hourlies how does the s p react to This particular level here is it able to Overcome these levels and then build a Case to again attempt 40 150 to 4200 or Is it going to get rejected come back Down to test the previous level of Support this level was in mid to late December here at around 3 800 points so That's what I can see happening at least In the short term paid particular Attention to these levels 4060 around 4080 should we overcome that then pretty
Clear evidence here is 41.50 to 4200 if We can get over those then of course We're almost in that free ground again That nice move to the upside 43s 45s and Of course that final top there at 48. so It's got a bit of work to do in the Short term stay tuned to the channel Like And subscribe otherwise I'll see You over in Tia premium thanks again Guys I'll catch you at the next video Until Then peace out