🏆 Free Crypto & Economic Report Emailed To You:
👾 Free TIA Community Discord:
📈 TIA Gann Swing Indicator
🔥 TIA Premium! Trading Courses & Exclusive Community
▶ Subscribe to the channel for more macro market analysis on Bitcoin, Crypto, Stock Markets and Real Estate Cycles.
UP TO $38,755 FREE! Crypto Exchanges
🥇 ByBit Free $30,030 + 0% Maker Fees (NO-KYC)
🥈 Bitget Free $8,725 (US + Global Users NO-KYC)
🇦🇺 Swyftx, Best Australian Crypto Exchange, $20 Free BTC
▶ My Official Socials ◀
YouTube
Instagram
Twitter
▶ My Must-Have Crypto Resources ◀
Education – TIA PREMIUM MEMBERS, Trading Courses & Exclusive Community
Charting – TRADINGVIEW ($30 Off)
Storage – LEDGER
Tax – KOINLY (20% Off)
Trading – TIA GANN SWING INDICATOR
Channel Sponsor: New Brighton Capital, Aussie SMSF specialists. Book your Free consult and use code “Pizzino” for $200 credit off:
This video is for entertainment purposes only. It is not financial advice and is not an endorsement of any provider, product or service. All trading involves risk. Links above include affiliate commission or referrals. I’m part of an affiliate network and I receive compensation from partnering websites. #crypto #bitcoin #cryptonews
With the state of the economy around the World the constant bear Market flood and Many believing that we are just on the Precipice of another further decline in The markets many are wondering how could This be the bottom for Bitcoin so this Has led to many questions around whether We have seen accumulation and a breakout Or whether we are just getting started For another redistribution pattern Before the market declines further Today's video is an update of the Wyckoff schematic I'm also going to Cover some of the areas that I could be Wrong in or at least what I'm seeing in The charts but of course we want to go Through and update where we are in these Phases and also give you a look at where Could the next bull market top be Looking at our timing Cycles so Regardless of what your beliefs are Whether we're at a low or about to see a Further low you've got a massive video Coming up like subscribe hit that Bell Notification icon and if you you guys Are interested in learning more about Trading and how I was able to spot the Bottom for 2018 2019 check out our Investor accelerator courses the link is In the top of the video description There is hours and hours of content to Go through and if you are a Wyckoff fan We have a Wyckoff volume accelerator Where we explain in detail what each of
The bars mean as we go through it within A Wyckoff schematic from the tops to the Bottoms and everything in between now if You want to discount on that sign up to Our newsletter link is in that top of The video description all right guys Enough of the shills at the beginning of The video let's have a look at where we Are with this Wyckoff schematic I posted This on Twitter a couple of weeks ago Now looking at the schematic itself There have been some discrepancies People believing that we are in a Different stage to where I'm currently Seeing this Market I'm looking at this Being phasey and I want to go through That in detail with you in today's video But I understand that many are still Believing where probably somewhere Around a phase B with this low being the Selling climax the low that we saw in November so there is a possibility of Being wrong but I have a bias towards The upside so take that into Consideration as we go through all of The data and you make your own decision After you've seen what I have to show You now we have new Cycles which is part Of the Wyckoff schematic itself Wyckoff Richard Wyckoff talked about this in how The phases play out and so I thought it Was important just to mention some of The new cycles that we have seen over The last four five six months because
These make up those extreme times in the Market so it's it's a must to understand How the news Cycles work it is more Subjective and you'll learn how to grow This out with your experience in the Market it's essentially what we saw Through October and November leading Into December which will all make sense In the Wyckoff schematic is a FTX Collapsed then the news media hit all Crypto exchanges you have to remember What happened in history Finance was Getting hit crypto.com was getting hit Q Coin was getting hit they were all Getting targeted by the media did any of Those ones go down simple answer is no Some people will hang on to that news And believe that'll happen in time maybe It will but we're trying to make money From the market going up and going down And If eventually Finance goes down in Five or six years what have you missed Out on in the meantime maybe you've Missed out on a bull market so it's Important to differentiate the timing Aspect of when these things may happen That's what happens to the Doomsday Media that continues to spout downside In the market they miss all the bull Markets eventually getting it right you Know the old saying a broken clock is Right twice a day the next stage of that News cycle is that the fear dies out They've targeted everything they can
Nothing else is budging nothing else is Cracking and breaking and so they move On to the next cycle we saw that with Stable coins as well stable coins Obviously happened before but if you've Been through one cycle now in Cryptocurrency maybe even two cycles you See that the fud the fear the Uncertainty the doubt is always coming At usdt it didn't collapse again if this Is your first cycle go and research the Previous cycle they hit usdt in the Previous cycle 2018 unfortunately I got Caught up in that and decided not to put Some of my profits with usdt I learned From that mistake and I hope you guys Learned from this cycle because they Continue to FUD out stable coins they Hit all of the stable coins because one Broke they suspect many of the others Will break but they're different you've Got decentralized stable coins and Centralized stable coins eventually that Fear dies out the market moves on comes Up with a new cycle narrative and that So far has been the US Banks the U.S Banks have collapsed then they go after Every single other bank I've seen a lot Of that on Twitter of light so that's The most recent cycle this will Eventually die out it is absolutely 100 Guaranteed that this particular news Cycle will die out and eventually you'd Probably expect that the markets will
Finally turn if they haven't already Turned with their stock market bottoms Back in October for the s p and for the NASDAQ our Aussie Market UK France some Of the biggest countries in the world Have had their bottoms already so I just Wanted to mention that news cycle Because of how severe these things can Be at the bottoms because that is part Of the Wyckoff schematic here looking at The different phases Richard Wyckoff Mr Richard Wyckoff talked specifically About this in Phase C it is in Phase C That the stock price goes through a Decisive test of remaining Supply Allowing the smart money operators to Ascertain whether the stock is ready to Be marked up basically is it ready to go Up because all of the supply has been Drained from the market meaning everyone That wants to sell at the most fearful Times Are they all out of the market and That's why it has to work around these Extreme news events because that's the Only time you can get the most amount of People and basically everyone that's Ready to sell will sell at those extreme News events All right so as noted above the spring Is a price move below the support level Of the trading range so here comes the Wyckoff schematic now the spring or in Another form or another word is called a
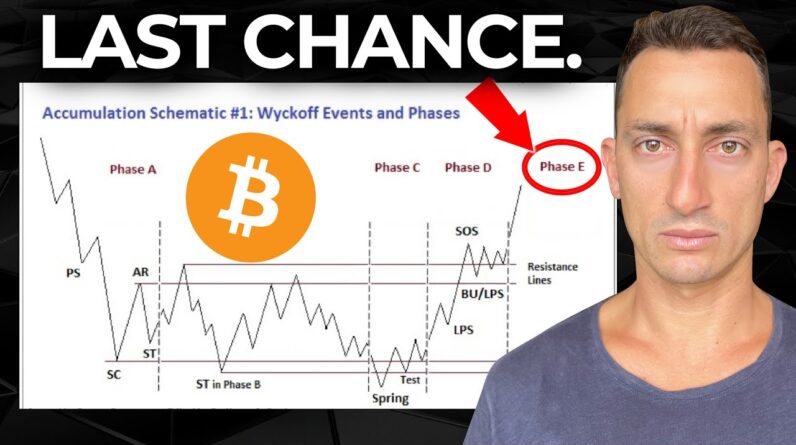
ShakeOut as well so that's the other the Terminology for that goes below the Trading range so this is the trading Range that I have here on the schematic So these dotted lines basically make up The different phases and this is all a Work in progress but you have to have a Bit of a road map to work with this side Phase a Then we have a potential phase B over Here Then a c A d and what I think we are now in is a Phase e and I'll explain more about that As we go through each of the phases here So I need to go through this so that we Can get to the point where can we be Wrong and also what are we expecting Next if we are right so looking at this We've got those trading ranges Established in Phase A and B quickly Reverses and moves back into the trading Range it is an example of a bear trap Because the drop below supports support Appears to Signal resumption of the Downtrend it appears to Signal the Resumption in reality though this marks The beginning of a new uptrend trapping The late sellers there so trapping the Late sellers in wyckoff's method a Successful test of Supply represented a Represented by a spring or a ShakeOut Provides a high probability trading Opportunity a low volume spring or a low
Volume test of a ShakeOut indicates that The stock is likely to be ready to be Moved up ready to go into a bull market So this is a good good time to initiate At least a partial long position which Is what we've been talking about with Our members over at the investor Accelerator at least initiating partial Long options opportunities for Bitcoin Whatever else you want to buy up into at Those lows maybe in the stock market Right but in terms of Bitcoin that is Precisely what I go through in detail Here accumulation distribution this is Something that I put together for our Members and we have the Wyckoff program Here as well in terms of what this all Looks like as we bring it together with The Wyckoff schematic here going through Each of the phases breaking this down Into small pieces as possible and Showing it on the chart this is what I've done to justify and support my own Beliefs in the market so I want you to Go away and do this yourself if you Don't agree with what I'm saying that's That's what you have to do okay so why Cost method successful test of Supply Represented by a spring Successful test of Supply so we've Tested that Supply extreme volume came In on this on the spring we did not last Under this level for very long in terms Of a Bitcoin or a crypto Trader you know
Like these areas seem like an extremely Long time how long is that in terms of Weeks we get to the November breakdown Until we break out Basically nine weeks you could say to The end of this test here was about six To seven it's really not a long time in The grand scheme of things however I Understand that the majority of Investors will think that's forever okay So that's what we got there that Indicates that the stock is likely ready To be moved up it's a good time to Initiate Longs okay so one step back is An example of a bear trap because the Drop the drop below support appears to Reserve to Signal resumption of the Downtrend so the drop below here is the Support That's a support right there and now we Drop below it appears to Signal the Resumption of the downtrend here is Something that the writer in that Article calls a check so we're checking Whether we get some more Supply come Into the market now we've got a higher Low and then phase D begins with a nice Big break on high volume that's why I'm Thinking that we are most likely in a Phase e because we've gone through a Phase D and we're not in a phase B at This current point in time so that then Brings us to phase d If we are correcting our analysis so
There's always a possibility being wrong What should follow is a consistent Dominance of demand over Supply Consistent dominance of demand demand Means the chart has to go up Oversupply so the supply sides have been Very short-lived and not very big at all Compared to what we've seen previously Look at all these moves to the downside Here if I scroll this chart in we are Really in the very small sections of This whole entire area these downside Moves are very small compared to what We've seen on the move down previously In the bear market so going back to Where we are in Phase d This is evidenced by a pattern of Advances sos's which is signs of Strength on widening price spreads so These are the the things that we have to See in the market and what I'm going to Use is our Tia ganswing indicator There's another shield for you guys for A tool that we always use in our trading Remember this is what we do full time so Of course we have indicators and tools That we'll use check them out links are In the description very inexpensive to Help you identify these things nice and Snappy look at these moves to the upside Here with our one week swing chart that Is bigger than any move that was in the Entire schematic so far so for me and When I'm interpreting this it's evidence
That a pattern of advances on widening Price spreads and increasing volume let Me check the volume bam increasing Volume compared to this entire period of Course this is the ShakeOut those down Bars are always going to have extreme Volume but look at where this volume Comes in here it's almost one of the Highest volumes in this entire period Except for the ShakeOut and for this Secondary test that I think is a Secondary test in Phase B according to What I'm analyzing here As well as the reactions so the last Points of Supply the supply have to be Smaller spreads with diminishing volume Smaller spreads There we go of course this coincided This one here coincided with the banks Collapsing and then it was extreme High Close that was the last of the last Points of supply and the backup here With what is that that is diminishing Volume As the market comes down diminishing Volume as the market comes down so looks Like phase D has met the rules here so That's why we are now moving on to phase E phase e and phase e the stock leaves The trading range okay stock leaves the Trading range if we have identified our Trading ranges correctly then we would Have to say that this has left the Trading range okay so it looks like
We've left our trading range there According to the rules laid out here Phase e the stock leaves a trading range Demand is in full control and the markup Is obvious to everyone unfortunately I Guess it's not obvious to everyone just Yet but I think if it was obvious to Everyone Then we would be pumping even harder so It has to be obvious to the majority Which is why we've broken through the Trading range let's not say the majority But at least those in the know Uh because of the rules that have been Met now of course I'm still going to get To the point where I think maybe I could Be wrong I'm always happy to to go Through that but I'm just going through This piece by piece painstakingly Looking at the rules and the structure Of how these phases are formed within a An accumulation range and once we get to A distribution somewhere down the track We can go through those again but Essentially looking at Phase e now Setbacks such as shakeouts and more Typical reactions are usually Short-lived so you know I'm not saying That we shoot straight up to 40 50 60 000 Bitcoin I do expect that we'll have Some some shakedowns as well I think It'd even be it could be stronger than What we anticipate something like what's Happened in 2019 we had a big move out
And then we had longer slow grinds to The downside that's all still possible As well I'm not saying it has to happen 100 exactly like this but probably in The early stage as we break out we would Expect that the the typical reactions or The downside reactions will be Short-lived so new higher level trading Ranges so essentially we'll be looking For reaccumulations at higher prices So we move this chart look to the upside Here somewhere maybe we start to form Another accumulation range and then Eventually you know we break out of that Range as well that's what is anticipated Within phase e so this is potentially What happens next and the reason for That is psychologically is that we start To form bases because we have to get Used to the prices again that's still Too fresh in our minds sub 20 000 Bitcoin you know it was only three weeks Ago that we touched just below twenty Thousand so psychologically people have To get used to the new prices and this Is what it says here new higher levels Comprising both profit taking so Traders Will take profits and then look to buy On those reactions Re-accumulation by large operators and These trading ranges are sometimes Called Stepping Stones you know that's What we talk about here as the market Climbs out so you've got a stepping
Stone here and then we started to step Out again higher and higher prices think About a staircase you've got the Stepping Stones on the way up higher and Higher doesn't mean that we'll never try And You know pump high and then set up a Redistribution come back down test some Of these you know higher levels form Another accumulation before moving Higher again those are all possibilities We'll have to wait and see what happens But these are probably some of the best Entries for Bitcoin based on Wyckoff Accumulation schematic if you in fact Believe this is where we currently are In the market so what happens next out Of an accumulation area it's where we've Been oversold we get the markup demand Is greater than Supply so that's Essentially what I think is happening Next this does not mean that we go into A new all-time high come on guys we've Got to be a little bit smarter than that It's not going to just pump to sixty Thousand dollars then we get into a Distribution that could come at 35 maybe It comes at 33 000 maybe comes at forty Thousand and then we get marked back Down again because at those areas maybe The supply comes in a little bit more Because what we've seen in the past you Can see that there are some levels here That were support and broke down around
35 and we have multiple other areas There which were previous resistance Levels support and resistance at 35 a Big one being the 50 level so maybe we Get a distribution here and then the Market come back down from that point so We're going to go through this over over And over again maybe we have another one A little bit lower and we get a Redistribution and a fall back and we End up putting in a higher low overall This is all the possibilities and Nothing goes up in a straight line or Easy to identify Stepping Stones Especially while the market is below the Old all-time high Things become much Clearer once we break through an All-time high the trends just continue On much cleaner because of how much Emotion is involved in the market and All the new retail investors that come Into the market as we break through All-time Highs but while we're Underneath these levels you can see in 2019 and 2020 it can be a difficult Period but the main thing to note is That it's likely that this is the Bottoming process like we saw in 2018-2019 And these same things were being said in Late 2019 that we could revisit the Three and four thousand dollar area and Maybe this was all a mega bear trap this Could have been the biggest bear trap of
All time And we were going to revisit lower Prices but of course that never happened Even a worldwide Global pandemic could Not push the price lower than those Previous low levels we'll continue to Update the Wyckoff accumulation Schematic week by week as these weeks Close because this is what the chart is On right now if you do want to stay up To date and learn how to implement this For yourself across any other Market Again top of the video description the Investor accelerator premium membership Check that out there is hours and hours Of content to go through setting up Investing and trading plans there is the Wyckoff Accumulation accelerator here as well That looks at volume bars we have the Gan swing Accelerator as well and You can also get a discount if you sign Up to the newsletter so go ahead and do That first and then get your discount to Get the membership all right so where Could we go wrong I think it's important To visit that and then why maybe these Charts are wrong in themselves so we've Got to understand both of these so like We've just gone through the phases Themselves I think there is a possibility of this Particular structure these schematics
Being incorrect because of one phase a I Think these are labeled incorrectly I Think the selling climax was more mostly Around June and this was that secondary Test because now we have seen the market Break out which like we confirmed in Phase D and phase e It's most likely that we have broken out Of those areas but this is the other Train of thought where a lot of people Are believing that we are only entering Phase B and the top of where we Currently are may be the top of the Trading range before we start to head Back down now that is a possibility it's Not what I'm thinking is going to happen Based on what I've talked about here in Phase D with the the push out on Increasing volume and increasing spreads Meaning the move to the upside getting Greater than the previous moves but it's Something to keep in mind just in case Maybe you think the price is going to go Back down so that you can see where This particular schematic could be wrong And maybe this one is becoming more Correct but for now I'm pretty certain This one is going to be classed as Incorrect which is why I'm still going With this particular schematic as we're Entering phase e long term viewers of The channel know that we've been Covering multiple signals and indicators That have allowed us to get a bit of an
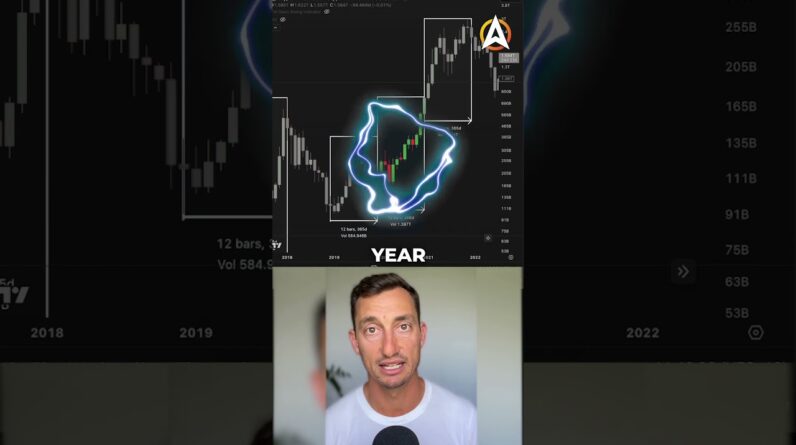
Insight into the market and anticipate The probabilities and likelihoods of That low there in November being the low For Bitcoin now one of those big key Indicators are of course the time Cycles So looking at those time frames of the Days of the downside and days to the Upside that is another key reason why I Think that we are in a phase e rather Than in a phase B if we're in a phase B That would suggest that we would have to Go lower again and if we were to go Lower again this could take some time Maybe a couple more months maybe into June you know another two or three Months from the this point and that Would then put the low on bitcoin very Far out from the traditional cycle lows Around this four-year cycle which Typically doesn't happen it's not Impossible like we know in trading and Investing nothing is impossible but the Likelihood is less likely that we would Then get a low somewhere around June or July and then start to work our way out To a new market top like I said it's not Impossible it's just not the the outcome That I think is going to happen based on Previous timing Cycles which have worked Out relatively well and we can see we've Got that 400 days or so down you know One year to 400 Days to the downside With about another thousand days to the Upside which leads me to the next bull
Market top this video has gone on long Enough you guys have got a huge piece of Information to go through with the Wyckoff schematic which is why I think Blows in but nonetheless I said at the Beginning of the video we would have a Look where does this next bull market Top take us if we project out a thousand Or so days from the current cycle low of November remember if we're wrong and the Low comes in in June then we've got to Project out again maybe some of these Timings change but the timings have been Pretty well on point for about a Thousand days Eleven Hundred Days to the Upside from the low about 360 to 400-ish Days to the downside that bear market so We're sitting at 376 to the downside If we go out a thousand days where is The next bull market top it's going to Be somewhere around September of 2025. Is it a straight line up of course not Will we get some scares with the Bears Coming back in guaranteed 100 look at 2019 you can see in uh the top here the Bears took control again for many many Months had another push out a dump Another push to the upside and then Eventually we got that move out that is More than likely going to happen you'll Get some nice moves to the downside the Bears will come back in and then we Start to work this this Market all the Way out into that Peak so potentially
We'll be looking somewhere around Summer to spring for the Northern Hemisphere guys of 2025 to to look out For a peak maybe we'll get some sort of Double Peak again where it comes in Early and we think the the whole entire Cycle is over that's a possibility maybe We do get an early Peak and a longer Bear Market And then we just get a quick final Peak Which would mean that the cycle is Weakening we'll talk about that in Future videos as this has gone on long Enough looking at the four-year cycle And what it means to Peak early in a Four-year cycle or later in a four-year Cycle we'll leave that for another video And talk more about the bull market top But I just want to give you that Insight At the end of this video If you stuck Around till the end like And subscribe Let me know in the comments section About this new bull market top what do You reckon summertime 2025 and your Thoughts on the Wyckoff schematic are You in this Camp obvious being in Phase E or are you in the camp of phase B let Me know your thoughts and comments down Below and if you did want to join us for A TIA premium get 105 bucks off signing Up to the newsletter so you can go Through and understand how to apply this To all of your own markets plenty of Detail there plus our weekly live
Streams that we go through all of the Market analysis thanks again guys I'll See you at the next video Until Then Peace out