🏆 (RELEASED TODAY!) Free Crypto & Economic Report Emailed To You:
👾 Free TIA Community Discord:
📈 TIA Gann Swing Indicator
🔥 TIA Premium! Trading Courses & Exclusive Community
▶ Subscribe to the channel for more macro market analysis on Bitcoin, Crypto, Stock Markets and Real Estate Cycles.
UP TO $38,755 FREE! Crypto Exchanges
🥇 ByBit Free $30,030 + 0% Maker Fees (NO-KYC)
🥈 Bitget Free $8,725 (US + Global Users NO-KYC)
🇦🇺 Swyftx, Best Australian Crypto Exchange, $20 Free BTC
▶ My Official Socials ◀
YouTube
Instagram
Twitter
▶ My Must-Have Crypto Resources ◀
Education – TIA PREMIUM MEMBERS, Trading Courses & Exclusive Community
Charting – TRADINGVIEW ($30 Off)
Storage – LEDGER
Tax – KOINLY (20% Off)
Trading – TIA GANN SWING INDICATOR
Channel Sponsor: New Brighton Capital, Aussie SMSF specialists. Book your Free consult and use code “Pizzino” for $200 credit off:
This video is for entertainment purposes only. It is not financial advice and is not an endorsement of any provider, product or service. All trading involves risk. Links above include affiliate commission or referrals. I’m part of an affiliate network and I receive compensation from partnering websites. #crypto #bitcoin #cryptonews
History is repeating the exact same Playbook that we saw at the depths of The lows of 2008 and 2009's Global Financial crisis let's look at the Similarities on the charts and what's Going on out there in the market Sentiment and use headlines to see if we Can make heads or tails of this bull or Bare transitional period in the markets Now I've also got the NASDAQ to get Through looking at some overhead Resistance we're not all bullish only Here the US dollar and of course BTC Which I've sold my plants for to buy Some more Bitcoin today only joking They're outside in the rain to look nice And fresh for the next video guys today Is the day that our free crypto and Economic report goes out so Link at the Top of the video description check that Out you can also check out some of the Trading results there from our members Who are crushing it short and long in The market all right it's enough of the Shells at the video description there You can get a link to at the top let's Dive into where the market sentiment is What's going on that is exactly like 2008 2009 that old history repeating and Rhyming and of course look at the charts To see where it is objectively in the Market crypto Fair agreed 57 where it Greed in crypto greed yesterday greed Last week neutral last month these
Levels are levels that we haven't seen For over a year we go back on the fear And create index here for crypto the Highest we saw was around 55 so Basically neutral back in March of 2022 As the market was climbing up into that Lower top before it collapsed that was The time that the Bitcoin conference was On and you had the likes of Peter Thiel Telling you how beautiful and fantastic Crypto and Bitcoin were meanwhile he was Selling billions of dollars of his Portfolios that is all documented out in The news whereas now we find ourselves a Year later much lower than those times However the greed is much higher so it's Giving us a bit of a Divergence between What the markets is actually doing the Market feeling and then I guess what the Headlines are trying to tell us so these Are a good signs for the bottoming Process you can see pretty evidently do I need to draw a red line here just to Show you higher lows forming in and on The market sentiment let's take this out To the Max and we can see that in the Past these are the sort of levels if we Go just that touch higher at around the 70s and 80s they're the sort of levels That we start to see some resistance When it comes to the market sentiment so We have to pay particular attention to Where the price is at for Bitcoin when The market sentiment reaches those
Levels we don't know exactly what the Price will be but we know when people Get too overheated in their beliefs in Greed that will have a whip saw back to The to the downside here and that will Start to cool things off that is going To be an interesting point to to note Where the Bitcoin price is because if we Get a higher low on price and we get That nice whipsaw back in terms of the Fear and greed so maybe we drop all the Way back to the 20s or 30s and we get a Lot of fear yet the price is higher good Things are ahead because because it's a Divergence when it comes to the price And the feelings just like how we saw Through these lows here with the the Market feeling a little more confident In themselves so this will be the point To pay particular attention to if we Start to get a top out here and where we Fall from that point let's have a look At where the price is from there in Terms of the stock market they're They're still quite fearful over there In stocks compared to the crypto and Bitcoin space previous close we were at Fear one week ago was also Fair one Month ago was greed that was mostly Around the uh the February dates where We had a little bit of a higher price There for February or some tops coming In and a year ago it was around that Neutral point where the market was just
Starting to climb down if we take a look At the Timeline this essentially lines Up with a lot of the tops and the Bottoms in the market same sort of thing For crypto we get greedy uh when the When the tops come in we get fearful When the lows come in the most recent Low was obviously the banking collapses In Middle of March there's March 9th and Obviously the reading for the next day Because we had to get through the ninth In order to get the reading for the 10th You can see it was at uh it was 24 and Then it started to drop off a little bit From that point as well and now the Market is finding a little more strength In it compared to what it was two weeks Ago so in terms of the fear and greed Index for the stock market it looks like It's putting in Bottoms and we're Starting to climb out of the depths of The lows that happened through June July And October of last year we're starting To put in a high low here for March and The prices are slowly climbing out these Are the same sorts of patterns that we See time and time again especially During significant lows like we saw in 2008 2009 that was the end of the GFC at Least for the stock market where it Rebounded very strongly from that point Now I'm not saying that we'll rebound Just as strong as we did back then but It seems like we are putting in a low
Just based on the market sentiment and What's going on in price now like I said I don't want to get too bullish because I know that triggers some of the Bears And some people think it's maybe too Biased towards the Bulls so I do want to Go through some of the the bear stuff at The end of the video as well this is Very similar almost exactly the same to What we have just seen in the markets in 2023 as to what happened in 2009 this is The sort of thing that I talk about all The time if you want to go back and do The research otherwise you stick around On the channel like And subscribe all That sort of jazz and you watch me do The research here Matt I won't attempt The surname two headlines leading up to The March 2009 low in stocks days before The start of a multi-year bull market All right to go and do this research Isn't too difficult but it does take a Bit of time money fund assets jump Exactly what we looked at in yesterday's Video here which is why I have this Screenshot up here money market fund Assets they jump just like we saw in 2009 the Peaks 2020 the Peaks basically Retail everyone pulling money out of the Market holding it in cash because they Are scared yes we saw the banks collapse Or at least a few of them compared to The hundreds that did not collapse
And they pull the money out at the wrong Times this happens time and time again That's why most people lose in the Markets 2009 if you don't remember the Exact low was March 2009 for the stock Markets investors panicked flock to cash Here is the headline money fund assets Jump asset and money market funds jump 18 billion in the last week is both Retail and institutional funds had a Healthy jump in assets according to the Investment Company Institute for the Week ending Wednesday total assets Rose To 3.9 trillion now of course these are Different times 14 years ago that was um Pretty high figures in the market like We can see through here this is around That 5 trillion four and a half and Believe that was around that four or Three point nine like it's saying here In the news article now the next Headline in March this article was Published making the claim that all S P 500 Bank stocks could go to zero exactly The same as what happened last week by Some of the biggest names in this space The guy's talking about that Banks could Go to zero be careful get all your money Out where you're going to put it what Could happen are we going to keep it in Our our mattresses this wouldn't be the Only time either this has happened Throughout history and like I talk often About the book The Secret Life of real
Estate and banking if you want to read That history some find it quite boring It goes back to the 1800s of how this Thing has happened to every single Bloody time go and read that book it's Fantastic for the history the S P 500 Could fall to 460. they bottomed at 666 Erie of course but that that was the Bottom figure for the s p they were Saying it could fall even further so the Headline March 8 2009 keeping your money out of the black Hole what if all financials finally Totally implode seek out growth funds so Exactly the same thing happened at the Low which is what we are seeing now you Guys have seen the headlines I I hope at Least you're following something there To see these headlines but not fall into The Trap of the emotions maybe this time Is different I'll give you that but After reading 220 years of History which Is that book right there on my shelf It's basically the same Playbook time And time again but most people forget Because it's almost a generation between These events happening and coming to the Forefront of the media Forefront of the Headlines and so as those Generations Evolve the Next Generation in their 40s And 50s they forget about it or they're Not in the markets anymore because They've lost everything they've they Couldn't be stuffed they go on just to
Live their life in their job the Next Generation comes through the 20s and 30s They live through something they think It's the end of the world because they Haven't studied anything in the past That's typically what happens I'm just The messenger here all right so looking At those headlines something we can see In recent times apart from the banking Collapses we covered this on the channel Here we looked at the highs for gas this Was the headlines at the time gas is too High people in Europe will freeze when It comes winter you just wait that was All the stuff we heard because remember This is June of 2022 we have July we Have August this is all summer time wait Until the winter comes everyone's going To freeze which then means I don't know How they connect these dots People can't afford their bills so Therefore they can't afford their homes And then they say in the market the Housing market will collapse very Different story now nine months later We're seeing rental prices rise in many Areas around the world it's not Everywhere but we do see it in many Places around the world uh the gas Prices have fallen 80 percent since that Time we were pointing out if the market Gets rejected here at about that eight Level then it's going to be Probably a down Market because you get a
Lower top this is not a monthly chart The breakdown here of the market Breaking the next low pretty quickly and Then the show's over here as it broke The next swing low this is our Gan swing Indicator tool again there's a link to This in the video description if you Wanted a quick Chill on that this is What I use for all of my trading 80 down Show is over this is how we read the Headlines using the charts the objective Stuff right here now Is the next unpopular opinion March 2023 Today's banking crisis will not have the Same impact on the s p and NASDAQ as the Banking collapse in 2008 even though We're seeing the exact same things in The headlines I don't believe we'll see The same things in the charts and I've Pretty much put that through on many of The videos over the last several months On the channel of course that's my Opinion based on my analysis I hope you Go away and take the data for what it is And do your own thing with it now the Other thing to note basically what I've Learned through history is if a market Is resistant to bad news meaning the Price is maintaining like we see with The s p in just a moment 3500 is the Bottom there Bitcoins put us low in at 15 and a half thousand if a market is Resistant to bad news that usually means One thing and it usually means we're
Turning the corner and we're potentially Starting a bull market remember through The bull market of 2021 if you are Around the bad news kept getting Shrugged off the good news kept pushing The market up then in a bear Market the Bad news pushes the market down and the Good news just can't hold the market up Or get any sort of rallies this is what Happens in a transition this is the flip From the bullish sentiment to the Bearish sentiment if you forgot about All of the major headlines last year Regulations are coming to crypto Interest rates are going through the Roof there's going to be a World War Three we heard about all of that in the First and second quarter of 2022 Russia But Russia but Russia but stable coins Collapsing in the third quarter of 2022 Exchanges going down in the fourth Quarter of 2022 but China there never Ends there's always something about China banking crisis first quarter of 2023 but recession we've heard that now For five quarters but QT so quantitative Tightening that was all of last year but Worst name it yada yada in history Meanwhile Bitcoins found that bottom and Is up this is just a look at the major Headlines I missed a couple when we were Looking at Tech layoffs as well and now We can see that the NASDAQ in a moment Is well and truly up from those lows so
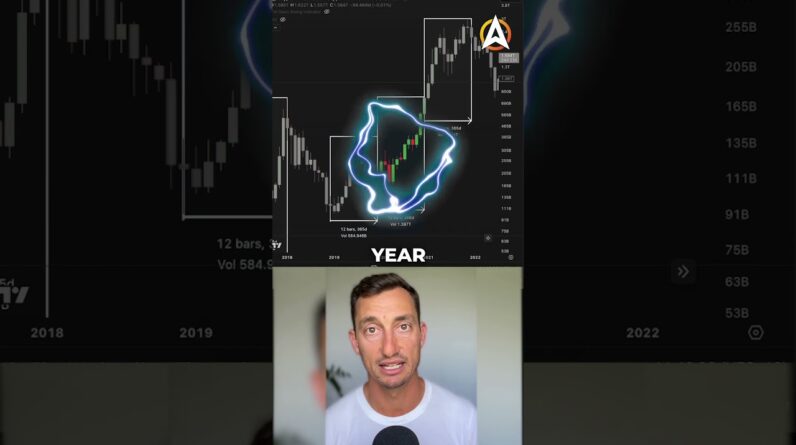
If you're not following me on Twitter go And do that there's a another shill as Well of course this is my channel so I'm Going to share my own stuff now looking At the McLennan volume summation Index This is fascinating yeah don't go Anywhere like And subscribe this is what This chart is about right here now I've Done the work I suggest going doing it For yourself because it's a really Fascinating uh exercise to do each of These bottoms and tops very close to Them if not being exactly on them it Correlates to the tops and bottoms in The market themselves so once we get Some of these readings at some of the Lowest points that's typically the Lowest points for the S P 500 so let's Have a look at a few of these and we can Go through and look at the the dates Here we've got May 12th and June 7th so We go back let's have a look at May 12th There's 13 and there is 12 almost at the Exact bottom of this little move here How do you know it's the exact bottom And it doesn't go any further that's to Be decided at the time of course but That's when we use our Um our TA on the chart as well just to Give us a bit of an idea we're not Trying to call the exact low but it Gives you a rough idea when you have a Bit of a glance that it calls the pretty Strong lows of that period sure this low
Went lower here in June but you can see It holding up at about 3 700 points from One low quick bounce under it a second Low third low fourth low and then the Market took off to that August top now Of course we're trading up at 39.70 at The moment which is basically above all Of these previous lows so that's a good Sign we can take another couple here We've got August 18 I believe the top is Around August 17 and then it started to Fall off we also had September top Around here at 12th 12th and 13th of September there is your September top of The 12th here is your top in August on The 18th so basically right around that Top here is the cycle low so far the 13th of October Surprise surprise there is your bottom There the 13th that's a negative reading As well so pretty significant now I'm Going to fast forward to exactly where We are today we're at a negative reading Again so from that October low pretty Decent run up and then we got back above The level reading of around 1500 there Was another low here in December Um so maybe I'll take a reading Somewhere around a thousand to about 1200 and maybe that's where we could Start to see another top out for this Move to the upside here is your December Low around 38 100 points there you go to December Peaks at around 4 4 100 points
And then we had that February top at the Second and the sixth here is the February top the second and the sixth Right at that reading there it's 1700 at The peak we're now in extreme fear that Would lead me to believe that well Either for the worst case hold out at These levels until the reading catches Up or we start to move up higher from From this point forward now for the NASDAQ we're at new seven month highs Pointing this out on a recent video what Does that look like we have closed the Week Uh higher than anything we've seen since August of 2022 the moment we still have Another three days to go for the Nasdaq's close but we're at least Setting up above these previous Resistance levels we've got to wait till The week closes maybe we close under it Ideally we want to see it close above That level of around 12 750 or so points now this was the area That I was going to say the resistance And the potential to the downside maybe We don't spring up as as fast as what Some are anticipating we do have a lot Of overhead resistance here at the 50 Level we have some extensions that run Up to this exact level here at between 13 600 and 14 000 points we have previous tops we have Previous bottoms so a support and
Resistance flip so there is a lot of Headway to get through two things if the Market slices through all of this Resistance which we can already preempt That is going to be extremely bullish Slice through and close above extremely Bullish I would not be getting on the Bandwagon of this Market it's now going To reverse and go back to New all-time Lows if we get rejected then we look for The higher low support that higher low Support for now it's going to come out Somewhere around twelve thousand six Seven eight hundred points to the to the Low side maybe even as far as 12 000 Which are these previous tops through November December and the Market's also Found a 50 level so far maybe that's Where we come back to but if it slices Room closes above that's a another nail In the already buried coffin of the Bears the Bears may come back to life Should it get rejected and close Underneath some of these previous levels Of February so I've got to go up and get Rejected come back and close underneath These lows and then come back and close Under these lows here it's the only time The Bears can come back to life at this Stage because it has to get back below Previous support levels where the market Has bounced from through bad news so it Has to be something even more severe Than the banking collapse probably nukes
From Russia could be one of the only Things that get us there we'll have to Wait and see In terms of the US dollar it looks like We're also heading down again this was Marrying the news up with the charts Which is basically what I do here on the Channel a lot looking at the the Headlines and how the market sentiment Is reacting compared to what other People are believing is going on and Using the charts to give us that data Peak of the market September we looked At this time and time and time again you Can go back six months on the channel And see those videos US dollar is strong Euros collapsing Great British pounds collapsing buy a US Dollar now this is going to the Moon etc Etc market showed some weakness lower Tops we were calling that on the channel Based on the swing indicator here Markets collapse from that point many Are still believing we're going to go up For another move to New highs on the US Dollar I don't think that's the case it Looks like we're failing at lower levels Than I had expected I was hoping for a 108 test but for now we are struggling To get back above 103 104. so we have to Wait and see whether this 100 10 100.8 Holds up otherwise looks like the show Is heading south again for the US dollar Which of course means it's going to be
Easier days for Bitcoin to keep rising And in talking of rising we have three Days to go for the monthly close on BTC Which could be 10 months out the highest Close in 10 months for Bitcoin the last Time we saw a close this high was May of 2022 at a price of 31 775. hold your horses I am not saying That Bitcoin will close at 31775 I'm Saying the previous highest close was That of May 2022 so now could be the Highest close since that point whether It closes here at 27 000 or closes down At 25 000. it's still going to be the highest Close in 10 months the only way it's not Going to happen is if we get absolutely Smashed rejected and closed below last Month's close of 23 100. so so far it Looks like things are looking pretty Positive for Bitcoin at this stage and The end of March is also the end of the Quarter 64.61 so far pretty decent run up in 2023 considering all of last year was Red quarters red red red red so it's Good to see that we got at least one Green I guess you'd have to say that the Maths is on your side here the Probabilities are you've got to Eventually see one green month it's not Going to be red forever unless you think Bitcoin is going to zero now going back To the previous Cycles the ones I want
To focus on uh 2019 2015 because these Were those years that the market was Re-accumulating and starting to work its Way higher into a new bull market 2015 Had a red green red green so it was Basically tracking along uh sideways Until it got out in 2016 and started to Work its way higher much bigger closes In in the green than there were in the Red so even though there were red Quarters they weren't that big of a deal 2015 that first quarter sucked and not Too much happened in the second quarter Third quarter not so bad and then fourth Quarter started to take off in 2019 we Had a massive gain in the second quarter I'm not thinking that we'll see that Exact same thing repeat we have had a Pretty good gain in the first quarter so Maybe we see a slight increase in the Second quarter and we flip these Quarters here what happened in 2019 the Second quarter was greater than the First maybe we've gone through that Accumulation already and we had the big Move in quarter one and maybe a smaller Move in quarter two or something flat We'll wait and see on that but at least We've got that big move out in quarter One so hopefully I've shown you how History repeats time and time again let Me know in the comments section down Below do you think this time will be Different do you think the banking
Collapses that we're seeing happen right Now will send the s p and NASDAQ to new Cycle lows below 3 500 points on the S P You know what my view is based on the Data that I've seen here and the Historic evidence of the news headlines At these lows not over the last 14 years But over the last 220 years it's the Same thing hopefully I haven't swayed Anyone too far to my side I'd love to Hear from you guys in the comments like And subscribe and like I mentioned Before you've got that Link in the top Of the video description to check out Our free crypto and economic report Coming out today thanks again guys I'll See you at the next one till then peace Out