
🏆 (SIGN UP FOR A DISCOUNT ON TIA PREMIUM BEFORE THE PRICE INCREASE) Free Crypto & Economic Report Emailed To You:
🔥 TIA Premium! Trading Courses & Exclusive Community
In this video we discuss why retail investors are exiting the markets, SP500, Bitcoin, Crypto, Nasdaq, and piling into cash markets.
We also explain how the Nasdaq breadth is widening and what this means to the markets going forward; is it bullish or bearish?
Remember to subscribe and share the content with a friend if you find it valuable to your investment knowledge. Thanks, Jason.
****************************************************************
LIMITED TIME – 16th May 2023 – FREE $230 USDT with ByBit & Bitget (No Trading Required):
🟠 Bitget Free $8,725 (US + Global Users NO-KYC)
▶ New Users: KYC & Deposit $100 or more to get 10% Cashback (up to $200 cashback in USDT)
🟠 ByBit Free $30,030 + 0% Maker Fees
▶ New Users: KYC & Deposit $100 or more to get $30 USDT bonus plus 0% maker fees for the first 30 days.
****************************************************************
UP TO $38,755 FREE! Crypto Exchanges
🥇 ByBit Free $30,030 + 0% Maker Fees:
🥈 Bitget Free $8,725 (US + Global Users NO-KYC)
🇦🇺 Swyftx, Best Australian Crypto Exchange, Limited Time $20 Free BTC
▶ My Official Socials ◀
YouTube
Instagram
Twitter
▶ My Must-Have Crypto Resources ◀
👾 Free TIA Community Discord:
📈 TIA Gann Swing Indicator
🏆 TIA PREMIUM MEMBERS, Trading Courses & Exclusive Community
🐂 TRADINGVIEW ($30 Off)
🔐 LEDGER (Limted Time $30 Free BTC)
👨🏫 KOINLY (20% Off)
This video is for entertainment purposes only. It is not financial advice and is not an endorsement of any provider, product or service. All trading involves risk. Links above include affiliate commission or referrals. I’m part of an affiliate network and I receive compensation from partnering websites. #crypto #bitcoin #cryptonews
Overnight we saw more Regional banks in The U.S dropped by over 20 percent and This is leading more retail investors to Pull their money out of the markets this Time piling it all into cash with some Of those great returns that they are Seeing in their cash markets so is this Going to lead to further collapses in The market are we only just getting Started and the Bulls are really Blindsided by what is happening in the Market I want to show you this today With the data showing up here on our s p We've got the s p to go through we have The NASDAQ Bitcoin and the total Cryptocurrency market so don't go Anywhere like And subscribe we've got a Massive one coming up for you today Looking at the data the facts on the Charts not the emotions or the Fundamentals that go on out in that Space lastly top of the video Description before our price increases For Tia premium the best education out There for Traders and investors in Crypto so the stock market cycles and of Course real estate Cycles as well prices Increasing you can get yourself a Discount using that link in the top of The video description all right guys so Let's start with the news headlines There have been reactions just recently With the US Regional Banks falling after The First Republic Bank failure has also
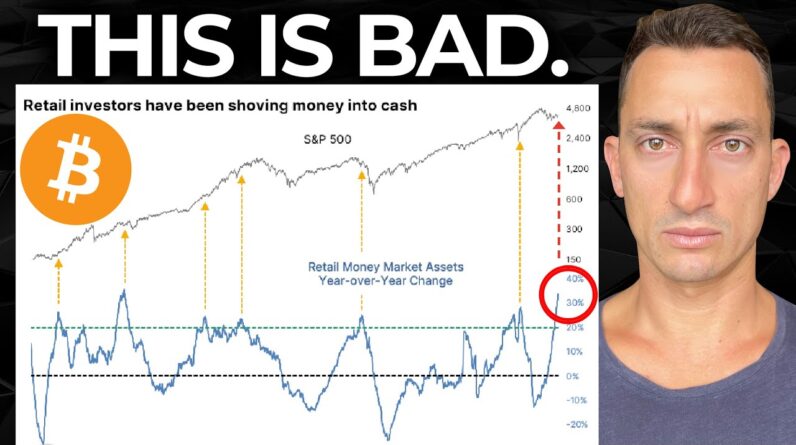
Gone down as well so this is shaking up The fears in the market and we don't Expect this to end any time soon however The markets are showing us something Quite different the Regional Bank stocks Are plunging with multiple stocks down 20 plus percent in a matter of minutes So this is just out recently Bank West Down 29 Western Alliance Bank down 25 Percent Metropolitan Bank down 24 and as The post here talks about they're saying Buckle up buckle up for worse things to Come now you guys that have been Following the charts know exactly what Is going on we're going to have a look At that on the charts and just a second Just the facts not the subjective Opinions just the facts on the charts With what money is actually doing in the Market the smart money the institutions The bigger players and maybe even some Of the smaller players like us here So retail investors have been shoving Their money into cash this is a pretty Good indicator of what is to come next We can see here retail money market Assets year-over-year change are at new Highs so we haven't seen these highs Since the late 80s early 90s going all The way back here on the chart so Typically this just means that investors For whatever the reason is they are Pulling their money out taking it from Wherever and then putting it into money
Markets basically things that are a Little more safe because they are Fearful of what's to come next in the Market and so they're looking for that Return and of course the FED has raised Interest rates we have another Announcement coming out tomorrow so make Sure you are subscribed to the channel So you can get that update as well with What's actually going on in the market When that happens safer returns pull the Money out they're not interested in that Risk however there is still a lot of Money that is interested in risk as We've seen with Bitcoin and the s p now Up 100 over 100 from the low for BTC and Up over 20 in the case of the s p and Over 25 for the NASDAQ since those lows The cycle low in October 2022 but we Want to have a look at this retail Investors have been shoving money into Cash what happens next well typically The market goes up from that point but I Want to preface this with we are getting Towards the end of the cycle it's going To come down to the time frame that you Are investing on like you know here we Talk a lot about the real estate cycle And so we're in this particular range Now things are going to get crazy over The coming years before we get a Absolutely catastrophic collapse but we Still have a fair bit of time if your Horizon is days
You're probably not going to see too Much of a difference here if your Horizon is months now we're talking if Your horizon is a couple of years from Now now we're really talking so if you Are focused on the shorter term try to Expand your horizon unless you're a Short-term Trader it doesn't really Matter what happens day to day just keep Watching the charts as we'll look at in A sec but essentially what we're looking For is this big move to the upside we've Already started to see the stock Market's bottom we've already seen real Estate bottom this is the data talking And I post this on Twitter as well we Are seeing crypto bottom in most in Particular Bitcoin bottom all right so Yes there are still people saying that Yes we could fall over and collapse past Those lows we've pointed out many times Before why that isn't the case at this Stage okay so typically this happens Towards the Peaks or getting towards the Peaks of the cycle so we do have in the Case of the 90s quite a long way to run When there was very high retail Investors shoving money into Cash Shoving money into money market assets Okay and you can see this happens all The way up they're getting a little bit More fearful especially after the Collapse they take their money out and The market basically runs up for several
Years from that point same thing Happened in the mid 90s same thing Happened in the late 90s and then the Market started to roll over in the early 2000s they did the same thing here so Barring this particular one which was a Good idea in 2008 where the market Collapsed every other time that we've Seen this for the last 40 years the Market has had another leg in it another Bull market section so I'm not expecting This to be another 10-year Run Or Another huge five-year run or anything Like that we do have limited time but Things are going to get nice and Volatile and crazy like we saw in the Mid to late 80s things were very very Crazy we saw it the same in mid-2000s we Saw it in the late 90s and after the Pandemic crash people were pulling their Money out at the bottom of the market Before we had those really huge gains to The Peaks in November 2021 for Cryptocurrency and January 2022 for the Stock markets so is this about to happen Again at record levels retail investors Pulling money out of the markets before They go on their Mega Run well like this Says here for whatever the reason the Implications are that the money or at Least some of it eventually tends to Find its way into the stock market now This chart shows exactly where those Points were like we just looked at and
The returns going forward from when the Retail investors pull their money out And put into Cash because they're scared Of what's to come which is typically Normal at the bottoms of markets people Are very unsure at the bottoms and in Terms of what's going on now assets were Growing by more than 20 year over year By January of this year 2023 so the Table below looks at a longer term Returns that's what we're looking for Here outside of 2008 which we know was a Good time in pulling them out but each Each of the other seven to eight Occasions they were not The returns were outsized gains over the Next two years so retail investors Pulled their money out for a small Percentage return because they were Scared yet the following two years were Outsized gains just how much this is how Much two years later in terms of the Percentage you can see that the median Was 43 that's 43 then you had a positive Return nine out of ten times so 88 Average Max gain as well 47 and the Average loss was eight percent so There's obviously still a chance here Like we know nine out of 10 times as a Win one out of ten times was a loss from This in the next two years so this would Mean going forward into the early stage Of 2025 and basically the returns are Huge over the next two years this is for
The s p not for Bitcoin not for Cryptocurrencies we've already seen 100 On BTC and in the case of Pepe for Crypto thousands of a percent return so Keep this in mind when you're looking Forward in terms of the short term them For the bearish signals out there the Fear that the market is going to Collapse the data is really suggesting That there are going to be some Particularly outsized gains over the Next two years as always I think it's Important to have a look at the bearish And users that are out there as well so That we can get an understanding of what Is being said as always like And Subscribe stay tuned to the channel this Is your home of macro cycle analysis if You're enjoying the analysis and you're Finding value from it do hit that Subscribe button down below leave us a Comment there as well so in terms of What is going on in the market in terms Of the bearish news we do have a lot of The breadth data that comes through Basically which stocks are hitting All-time highs to lows how far apart is That is there only a few stocks that are Pushing up the market and a lot of Stocks that are going down to New lows In the case of the NASDAQ yes there is a Big difference between the ad line so The advanced decline online for the NASDAQ new lows in the line have been
Hit but They're not consistent consistently Preceded negative returns other than Short term this cumulative Advanced Decline line for the NASDAQ is in a Downtrend over time so the NASDAQ is Full of text docs and like we know with Cryptocurrencies the majority of tech Stocks just don't work out there is a Few that do and they push the market up They take the market all the way up and They basically start to bring in all of The gains that's what's called the Network effect which is what if you're In crypto it's what you're expecting Bitcoin to do maybe ethereum if you like Ethereum and maybe a few other Cryptocurrencies which basically pull in All of the network out there and get you To use just one or two platforms Obviously the NASDAQ has Amazon Facebook Google these sorts of things are what Push the market up and the majority of People just go towards one most of us Just use Google most of us just use Amazon there are alternatives out there But the majority of us stay on those That's why a few of the stocks keep Pushing this market up and the breadth Gets lower and lower and lower because The majorities other companies just Can't get traction therefore they start To put in lower lows because the network Goes towards just a few players and
Moves away from the other players and Being that it's the NASDAQ made up of Tech stocks looking for that growth that Is what happens over time this is 50 Years of data of the cumulative Advanced Decline going down that is an absolute Mega downtrend and we expect it to Continue meanwhile the NASDAQ is able to Continue to push to higher prices so This is getting the idea around the Bearish news that's out there this whole Breadth thing if you have been aware of It maybe you haven't but to explain it The majority of the gains go towards the Few in the tech space while retail Investors are fleeing the markets going Into Cash assets things that are safer Looking for those higher returns we have Many major points that we've been Looking at looking at on the chat Channel for months now since those lows In October of 2022 for the s p for the NASDAQ and November for Bitcoin so these Are things that we've brought up many Times before on the channel but it's a Nice summary here from a tweet from Seth Which is brought to us from fund strats Tom Lee it's just a nice way to put them All together the same things that we've Been looking at on the channel but just As a reminder inflation Pete June 2022 So this looks like things are Potentially coming down but nonetheless Even if it doesn't the markets are
Showing that the price is going up and At the end of the day that's what we can Trade we can trade the price going up or Down number two high yield spreads Peaked that was July 2022. so the Rationale here is typically when high Yield Bond spread Peaks uh Peaks lead Equity bottoms so they Peak and the Bottoms come in so that's basically what We've seen so far high yield option Adjusted spread has not made a new high Confirming July 6 was low and then we Saw the low for the equities the bottom There in October so the higher yield Lead The bottom for the equities number three Rule of first five days and we looked at This in January there was a lot of major Indicators coming out in January after That bottom in December the higher low So since 1950 when those first five Trading Day Day gains were more than one Point seven percent seven out of seven Times the market was higher so we looked At this early on in January as well There was also one that came out for the Month of January of January was higher As well but I'll leave that for another Video but essentially this has shown 100 Hit we don't always want 100 hits but 100 hit when those first five trading Days were up it's a positive sign for The market for 2023. two consecutive Quarter gains we've now had that in a
Row so essentially it's just saying that Once we get that we get higher prices Throughout the following year more than 15 weeks above the 200 week moving Average we've now had that since 1950 12 Instances and never a single instance Markets made a new low referencing that The fact that the stock market has is Now traded above its 52-week moving Average for about six months and the Last one here investor sentiment is Overly bearish this was back in January We're talking about this at the lows October November December and January The difference then was that there was a Lot more bears in the house than there Is now more people are starting to Switch to that bullish side granted and We will get some corrections but this is What was going on back then what we're Talking about on the channel as well so Some of the things that we have coming Up this week is uh the federal funds Rate they're looking for a quarter of a Percent rate hike and this is going to Take all the noise in the news and the Narrative away for at least the next Couple of days don't forget these things That we've gone through here it's six Points and the April data that we looked At in yesterday's video so nonetheless Should we get the extra quarter of a Percent rate hike volatility in the Short term nonetheless the markets are
Doing what the markets do overnight they Were down 1.1 but remember what we look At here is the low here is the December Low here is the much low the banking Crisis low here is the recent low in April and possibly let's see what Happens but we may have just seen Another higher low on a shorter term Time frame as we try to break 4 200 once And for all in this cycle nonetheless if We don't then we can still look to the Downside here around 4080 points four thousand sixty points And then the 50 level at now four Thousand and twenty points so plenty of Support to the downside here maybe we Just need to buy a little more time While we wait for some of these news Announcements to get passed and then we Start that charge back to higher prices So keep that in mind if you are in the Markets or looking to get into the Markets keep an eye on where the lows Are coming in on the chart remember the Majority of macro analysts maybe they're In really high positions in billion Dollar hedge funds or multi-million Dollar hedge funds majority of them for Some reason or another just don't look At a chart and look at where those lows Are coming in or pay attention to some Of these extreme news events which after That point the Market's pushed higher From this banking crisis low the market
Was eight percent away from the Resistance level fast forward a month And a half from that date nearly two Months and we are now less than two Percent from the resistance level same Deal goes back to the October low the Cycle low the bear Market low of 2022. The market had a really strong bounce Out of that October low and was 14.4 Percent away from that low and on each Of the occasions continue to get higher And higher the same sort of thing has Happened for the NASDAQ from the low we Are now up 27 we just put in a new Fresh Height for 2023. to the downside each of These moves are getting less and less Granted yes this could drop a little bit Further but these are the moves that you Want to measure the the longer term Moves here and this was the banking Crisis dip here 5.4 percent pretty crazy That these have not been taken out yet But still haven't been taken out when More banks have collapsed and we're Getting awfully close to that next Resistance level of 13 600 for the NASDAQ as for BTC overnight we just Looked at the U.S Regional Banks Collapsing and Bitcoin decided to go up 2.1 percent it is above our eight uh 28 400 level which is a key support level But it remains underneath the 29 000 Level which is the 50 level here so While it remains in this Zone it's a bit
Of a No Man's Land we're waiting to see Whether the market decides to break down From 27 and 26 and a half or if it Decides to push above 29. 29 is the key Area for the Bulls at the moment and to The downside the Bears must break 26 and A half in order to get anywhere back to 25 or 24K so while we remain here this Is basically a no man's land but it's at Least good for the bear the Bulls while It holds here between these two key Resistance levels as for the total Cryptocurrency Market well it's still Just hanging out above the previous Resistance levels which were previously Support back in the bull market of 2021 That was our collapse into May June and Then it came back as resistance in August of 2022 so this Market remains Just on that level it is back in the Trading Zone of the previous High However it's just above that level so Just like Bitcoin the rest of the Cryptocurrency market cap is in a bit of A No Man's Land probably because we're Waiting to see what happens with some of These news announcements nonetheless the Trend is up higher and higher and higher Lows of forming so can the markets fall Yes but the big question is do they Break key support levels I do think There has to be some sort of pullback That's just a normal Market correction But I don't think they're going to break
Key support levels these were the levels That we had on the chart from a long Time ago looking at final capitulation Zones worst case capitulation weeks okay Worst case here and we only made it into The final capitulation zone so it's a Good sign that we've seen the markets Push up this is a total cryptocurrency Market cap and I don't expect them to Come back now and break the Key Banking Crisis low that was that March date or The FTX collapse and then accumulation Breakout zone so I think these two zones Are reasonably safe now for the total Cryptocurrency market cap like And Subscribe links in the top of the video Description where you can learn more About macro cycle analysis with Tia Premium before the price increases we're With a discount it's a long sentence There but you get the just top of the Video description and if you want to get Some free usdt with buy bit and bitget No trading required use these links in The video description a couple hundred Bucks there of usdt links in the Description as per usual guys thanks Once again for your attention if you Found value you know what to do like Subscribe share it with a friend who Might still be in that bearish camp let Them know about the data that has been Showing higher and higher lows while the Rest of the market has been so bearish
Looking for major collapses we've been Here on the sidelines not getting all of The support because that's what happens At bottoms people don't want to hear What is I guess good for their Portfolios they just want to hear what They want to hear and they want you to Repeat those same things so I really Appreciate you guys being here Especially towards the end of the video Let me know in the comments section if You still made it by giving me a nice Thumbs up emoji nice and simple today Have a look at the comments down there I'll be back again with a new video Until then take care peace out