
🏆 (SIGN UP FOR A DISCOUNT ON TIA PREMIUM BEFORE THE PRICE INCREASE) Free Crypto & Economic Report Emailed To You:
🔥 TIA Premium! Trading Courses & Exclusive Community
Remember to subscribe and share the content with a friend if you find it valuable to your investment knowledge. Thanks, Jason.
****************************************************************
LIMITED TIME – 16th May 2023 – FREE $230 USDT with ByBit & Bitget (No Trading Required):
🟠 Bitget Free $8,725 (US + Global Users NO-KYC)
▶ New Users: KYC & Deposit $100 or more to get 10% Cashback (up to $200 cashback in USDT)
🟠 ByBit Free $30,030 + 0% Maker Fees
▶ New Users: KYC & Deposit $100 or more to get $30 USDT bonus plus 0% maker fees for the first 30 days.
****************************************************************
UP TO $38,755 FREE! Crypto Exchanges
🥇 ByBit Free $30,030 + 0% Maker Fees:
🥈 Bitget Free $8,725 (US + Global Users NO-KYC)
🇦🇺 Swyftx, Best Australian Crypto Exchange, Limited Time $20 Free BTC
▶ My Official Socials ◀
YouTube
Instagram
Twitter
▶ My Must-Have Crypto Resources ◀
👾 Free TIA Community Discord:
📈 TIA Gann Swing Indicator
🏆 TIA PREMIUM MEMBERS, Trading Courses & Exclusive Community
🐂 TRADINGVIEW ($30 Off)
🔐 LEDGER
👨🏫 KOINLY (30% Off)
This video is for entertainment purposes only. It is not financial advice and is not an endorsement of any provider, product or service. All trading involves risk. Links above include affiliate commission or referrals. I’m part of an affiliate network and I receive compensation from partnering websites. #crypto #bitcoin #cryptonews
There's rarely ever a dull day in the Markets and this is for good reason of Course it is to capture attention even On days where there isn't much happening There is a news story a news narrative Made about something today is no Different to that so let's dive into What that narrative could be how to Unpack it and what we see moving forward In the short term and the long term make Sure you hit that like button and Subscribe to the channel plenty more Great macro cycle analysis coming up for You every single day apart from Weekends Like we had just a few days ago where we Looked at the US dollar and its Relationship with BTC really important Stuff so do make sure you have hit that Subscribe button links in the top of the Video description for our free crypto And economic report as well which you Should have received by now as it went Out on Wednesday all right guys let's Start this journey with the stock Markets big stuff for the NASDAQ again Hitting a new Hive for 2023 but before We get to of ourselves the S P 500 is Just finding a little bit of overhead Resistance here at 41.55 this is not Surprising if you've been following our Channel for months now this has been the Resistance level 50 of the bear Market Trend so the top to the bottom huge Volume coming in at these lows huge
Volume at the banking crisis low almost Dead on the other 50 level as well on The way up you can see that it hit and Then jumped above that level on good Solid volume so it's no surprises that We're still seeing a bit of a hold up Here because this is a very significant Level for the market to overcome the Good news for this is we're not seeing Further downside or major downside Anything that's going to collapse the Market past significant support at Around 3 800 or even the cycle low that Is currently sitting at 3500 so so far This has all been relatively stable Environment for the S P 500 and that's Also showing up on the vix so we've been Covering the vix as another indicator For the start of a bull market and bear Market bottoms and tops it's a great Indicator to let us know what the Sentiment is out there so what we've Seen recently is the market fall under This zone of 17. and so we know that Anything under this 17 zone is the Likely start of a bull market or at Least in that sort of bull market Territory the territory where the Bears Are losing control this is at the Beginning of the move underneath this Level and this is where we currently sit We're at the beginning of this move like You can see here as well early 2021 we Know that 2021 was that bull market year
Eventually it rolls over you get the Peak of a bull market and then the Collapse and this is shown on the vix Here with the volatility creeping in Right now we've seen lower highs the Volatility is dropping off and we are Slowly grinding our way underneath the 17 level meaning the volatility is Reducing and it is possible that we Start this bull market as we continue to Break higher and higher you can see it Happens time and time again through the Volatility index where you get these Lower lows forming lower highs forming Lower lows lower highs you get some Quick breakouts with that form Significant lows in the S P 500 and the NASDAQ and so on but then it starts to Roll over and you get this nice Trend Back underneath the 17 level it's no Different this time we had the 2020 Pandemic low the market dropped off and Eventually it rolled back under the 17 Which led to that continued increase to The upside moving over to the NASDAQ We've just had a new highest daily close For 2023 this is on the weekly chart as We have one more day left in the trading Week so all all signs are pointing Rather positively to the NASDAQ yes There are some signs that the market is Slowing down as you can see here with The higher lows forming higher highs as Well but you're getting that ascending
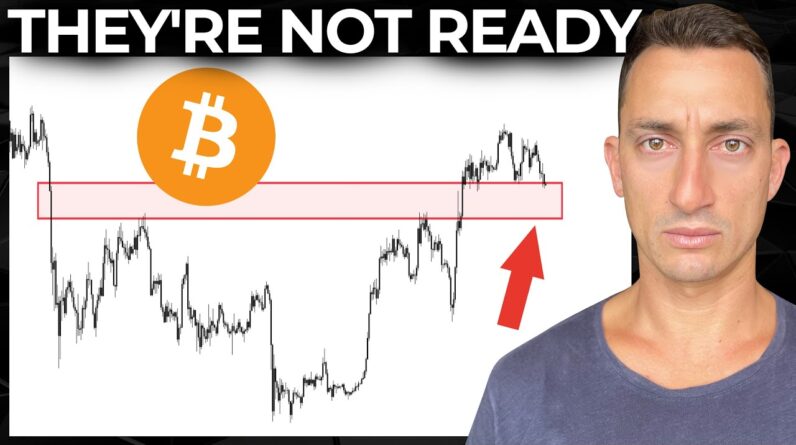
Wedge as we move in to the resistance Levels here at thirteen thousand six Hundred but we've had some pretty Significant volume coming in at these Lows more significant volume at the lows So trying to weigh up the differences Here with the weakening to the upside And the strong support at the lows Eventually we will have some rollover Whether it's here or whether it's above That level yet to be decided we are Working our way higher now but not each Of the indicators are equal if we're Looking at the macro you have stronger Macro bases forming than daily weakness This isn't to say that we're going to Roll over tomorrow or the next day we Could continue up and actually break out Of this resistance level the difference To understand is that you can have Shorter term weakness but you still have Longer term macro support in the Background so you are going to get some Sort of rollovers eventually like we've Seen over the last few months it's just A natural market movement the main thing To note is where are the significant Macro support structures what would Invalidate the entire picture here so Far so good the same signals and Indicators go for all markets Bitcoin no Different we've had the lows form 15 to 18 000 we had the banking crisis low Here at 19 and a half to twenty thousand
Dollars with a huge jump that took out The double top at 25k now the market has Gone on a bit of a consolidation is it Redistribution before we drop lower is It re-accumulation before we test and Maybe potentially go higher yet to be Seen we have to wait for those breakout Points but what is actually happening is Some sort of consolidation a pause in The price consolidation is exactly what Markets need we follow the fear and grid Index to understand what the market Sentiment is out there and we can see That this has been on a downtrend now Since putting in those Peaks at around 64 even earlier or mid April hitting Around 68 to 69. you can see the trend Has slowly being doubt which is just Resetting the heat out of the market I Don't think anyone can argue that there Was a lot of heat in the market and Basically went bananas with peppy coins And all the mean coins of course people Making a lot of money everyone getting Excited and then people buying in too Late and of course markets dumping on Them so we need time to reset the Structure here reset the price structure And reset the market sentiment that hype That has been in the market so take this Back with a little more data in here This is exactly what we've been waiting For we need to see the reset here it's Gotten too hot a little too quick
Nothing as quick as what happened in 2019 where we just shot straight up to Extreme greed Bitcoin going from 4k on The breakout to fourteen thousand Dollars nonetheless we do need to see a Reset and eventually we should see some Sort of movement back under 50 probably Back under 40 would be a better area to Get this reset going on so we see we saw That happen with the banking crisis low Here it only just basically got to the Low 30s these are typical Market Movements that have to happen in order For the market to reset so we can Prepare for the next move in crypto and The stock market which leads us over to What has been happening with the US Dollar the old collapse in the USD these Were the huge news headlines like we Covered here on the channel back over a Month ago the headlines were how Everyone was leaving the US dollar China You had France in here you had the Middle East you had Africa you name it There was a headline about a country Getting off the US dollar and trading in A different currency whether it was Russian rubles whether it was the Chinese one whether whether it was Euro Whether it was then coming up with a new Currency I bang on about this because it Is the news headlines what happens at Those points and this is going to show Us what happens in at least the short
Term and then the macro picture for BTC So just as a reminder these were the Headlines a month ago they were extreme In fear for the US dollar I don't know If anyone wants to argue that but they Were definitely extreme fear for the US Dollar late March early April and now we Find ourselves coming up to mid-may You've been following the channel which I think you should hitting that like And Subscribe button this is the macro cycle Analysis that we are known for so this Was the major fear for the USD what do We say at the time we said that this is Potentially a short-term low or this is The chance that we get to go and test Those higher prices of course if you get A low the market finds some support Maybe it's time to go and test slightly Higher prices just looking up here at Around 103 maybe 103 and a half Currently sitting at 102. we had that First low on the second of February Which is also a top in the other markets A local top but basically coming up to This news this is where the news was Most fearful which sent set off my Spidey sensors saying that we're Probably going to see a bit of a move in The US dollar and of course when we get A move in the US dollar this typically Puts pressure on other Commodities and Of course Bitcoin is no exception to That now we can take a step back
Remember what we were looking at during The peak of the US dollar hype in September of 2022 we said it at the time Nearly calling it to the exact day Although I'm not trying to get anything To the exact day it just so happened to Work out that way because of how Ridiculous the news headlines were and How much the media and people who Weren't even in the news headlines media Were talking about the US dollar And at that time the US dollar was Peaking and then started its major Collapse we can see it fell from 115 all The way down to 100 so a very Significant collapse like I pointed out In the video this week uh wanting crypto Bloodbath preparing Bitcoin for the next Move this one here we're looking at Major Cycles on the USD stuff really Important stuff here to understand so That we can get a bigger picture of What's going on out in the markets and Prepare ourselves for what's next And what we could see from this point is We're looking at USD to eventually Continue its move to the downside based On stock market Cycles based on real Estate Cycles based on economic Cycles Big Stuff 20-year cycles that we've seen Happen over many many many decades so in The short term is likely we could see Some upside we've pictured together how Bearish the news was at these low prices
Remember how big those headlines were There was a lot covering everywhere Saying the US dollar is about to go down And this was the end etc etc yet look Where the price is now compared to where It was back then almost nothing Basically nothing in it for almost the Last two months so this could be that Time we could start to get those higher Lows and we go back up to test that 103. As I said this is going to put a lot of Pressure on Commodities Bitcoin Etc and You'll start to see those prices Maybe Stay steady not move maybe go down a Little bit from there but the same thing That happened at this low happened at The high and eventually it'll happen Again at the next significant low or High as well so with that in mind in the Short term with the possibility of a Short-term play to the upside that could Lead Bitcoin to some lower prices not Changing my overall mac review because Of what we understand about the Cycles Here so that is the first or one of the Big narratives happening at the moment We see a down day in Bitcoin we see an Update in the US dollar we see a autumn On the US dollar there's the 14th of April We see a top On bitcoin the 14th of April so there's A lot of these occurrences that you can See throughout the chart which is
Probably why we're seeing a bit of a Pause here for bit Bitcoin like you can See on the US dollar a bit of a pause Here on the US dollar before maybe it Moves higher so kind of simple stuff When we break it down like that The other thing we broke down on this Particular video was the macro Cycles Where Bitcoin uh breaks down and where The US dollar goes up kind of similar Areas like we could see back here there Was the peak which was coming in through These lows as the US dollar started to Break down that was bang on the FTX Collapse and as it continued down there Goes Bitcoin continues up from that Point so now we find ourselves at a Pause just like the US dollar Potentially coming together another Point the other big thing that is going On is the liquidity in the Cryptocurrency markets liquidity Liquidity everyone talks about it saying We need more liquidity in the markets to Pump the markets In some cases yes other cases Not so much but if you start to dry up The liquidity it becomes easier to move The markets that's just one idea that's How you get the pump and dumps in Old Coins think about them releasing a few Percent onto the market to retail and Then being able to pump the price and Then dump on the retail when you see
These big gains come up that's one way The other thing we look at here say for Bitcoin is that as the volatility which Is this black area in the background as That dries up you typically head towards Significant lower areas so like I did Here again and again and again so if we Are drying up in liquidity that is a Sign of some sort of consolidation and Potentially depending on what stage of The market you believe we're in if You're on the channel you know where we Think we're at it's potentially a sign Of accumulation or reaccumulation as the Market waits to see what happens next That doesn't mean that Bitcoin holds its Ground exactly at this price right here Yes it can come back and test some other Levels but on the grand scheme of things The broader picture we could be in Something like this this period right Here in BTC that was back in May June of 2020 so May June July The liquidity on the exchanges dried up That point no one was trading got Extremely boring that was a very very Boring period then all of a sudden you Get a pop another consolidation a quick Dump to test more consolidation Market Takes off I don't think we are at the Stage of this boom but we are Potentially in this sort of structure Itself so this is potentially likely That we're seeing the drying up of
Liquidity on exchanges as we go through An accumulation period as the sellers The buyers start to figure out that There is less Supply on the market which Could then cause Panic later on for Higher prices what we need to see in the Charts to understand if it was going to Be a pop-off to the upside or to the Downside is of course the support levels Holding so like we saw in 2020 you can See the support level continue to hold And then it held again at higher price Then you get the pop-off But if you Start to get this consolidation with a Lower highs forming slight little Breakdown then lower highs again then The bias has to be to the downside in That case whereas for now we're still Holding above that 24 25k Zone we still Have 22k in play and we still have the 19 and a half K banking crisis low in Play as well so there are going to be Key levels on the chart while we go Through some sort of period like this Where the liquidity dries up on Exchanges but when that happens we know For a fact that you eventually get that Market pop off because the liquidity is So low on the exchanges we know that the Markets are easier to manipulate when The liquidity dries up on the exchanges These are some of the macro cycles that We've been covering on the channel for Quite some time so if you are finding
Value from the content you know what to Do hit up that like And subscribe button Down below now the last chart I've got Here is the monthly Bitcoin chart we Looked at the selling may go away Narrative that's very popular at the end Of April and early May for obvious Reasons and of course right now we're Seeing May as a negative month so the Conclusion that we came to on that video On the channel where we looked at this Data itself is that you have to Understand what is selling mate and go Away some people look at it as just may Others use the data that's been around For a long time where it's sell at the First of May and buyback at the end of October so around the 31st it's that six Month period does worse than the November to April six month period and Others will look at key turning points Within the month of May something that We like to look at here but taking a Nice simple view of the market something That we talked about in that video as we Recap it just now looking at where we Currently are in the cycle if we believe We are in that first stage of the bull Market not this end stage where the Market gets this blow off top and Retail Joins the party and thinks that all Their coins are going to make them Rich The first stage this stage where it's Still quite undecided between bears and
Bulls and eventually you've got to pick A Direction so that you can buy or sell If we believe we're in this first stage Of these bull markets like we have been In the past then these are the times Where from May to October we typically See the market put in gains so going From the pink line to the white line in Each of these occasions at the beginning Of the month even they could be quite Small like we saw back here in the the First one here in 2019 that was quite a Small gain from May to October Nonetheless it was still a gain so the First uh three movements May to October Have all been gained in the past going From October uh sorry May uh May to October in the first stage of that cycle There so you can see each of these times Nice gains so if we believe we're in That first stage of the bull market then Looking at history it's possible that we Get a gain it may be small but there Will be a gain it doesn't mean that it's Going to be an easy ride there like We've seen in the past there are Definitely some pretty significant UPS Pretty significant downs and pretty Significant boring periods so let's keep An eye on that moving forward on the Channel where we currently sit in the Cycle that on May to October thing make Sure you do like and subscribe check out The links top of the video description
If you want to get some freebies on your Crypto exchanges bit get and buy bit Still giving away their 200 bucks until Next week so get on board with that and Of course with the Aussies Swift X there Is 20 bucks a free BTC thank you to our Channel sponsors guys have a fantastic Weekend if I don't see you tomorrow Otherwise I'll be back here next week For more uh Bitcoin crypto macro cycle Analysis until then take care and peace Out