
🔴 Limited Time Triple Bonus with Swyftx, FREE $30 BTC Until 26th May!
🇦🇺 Swyftx, Australia’s Most Trusted Crypto Exchange
https://trade.swyftx.com.au/register/?ref=jasonpizzino&promoRef=jp30
🏆 (SIGN UP FOR OUR FREE TRADING WORKSHOPS) Free Crypto & Economic Report Emailed To You:
🔥 (PRICE INCREASING SOON – SUBSCRIBE NOW) TIA Premium! Trading Courses & Exclusive Community
Remember to subscribe and share the content with a friend if you find it valuable to your investment knowledge. Thanks, Jason.
UP TO $38,755 FREE! Crypto Exchanges
🥇 ByBit Free $30,030 + 0% Maker Fees:
🥈 Bitget Free $8,725 (US + Global Users NO-KYC)
🇦🇺 Swyftx, Best Australian Crypto Exchange, Limited Time $30 Free BTC
▶ My Official Socials ◀
YouTube
Instagram
Twitter
▶ My Must-Have Crypto Resources ◀
👾 Free TIA Community Discord:
📈 TIA Gann Swing Indicator
🏆 TIA PREMIUM MEMBERS, Trading Courses & Exclusive Community
🐂 TRADINGVIEW ($15 Off)
🔐 LEDGER
👨🏫 KOINLY (30% Off)
This video is for entertainment purposes only. It is not financial advice and is not an endorsement of any provider, product or service. All trading involves risk. Links above include affiliate commission or referrals. I’m part of an affiliate network and I receive compensation from partnering websites. #crypto #bitcoin #cryptonews
A new 24 hours in the market and we have A new narrative this time it's ai ai is Back on the menu and video has pumped to New all-time high prices taking the NASDAQ 100 along with it to new fresh Highs for the last 400 Days is bitcoin's Turn coming up let's take a look at that In the charts today we have time frames To get through with BTC looking at Historic data going through the bear Markets and the bull markets to give us An idea of when we could expect Bitcoin's Fortune to turn we're also Looking at the dxy as it continues up Amidst the backdrop of what's going on In the economy we also have the NASDAQ And Nvidia and of course a quick look at The other stocks as well so guys if you Haven't already you know what to do hit Up that like And subscribe to the Channel this is your home of macro cycle Analysis the only place where for some Reason you're getting the truth about The markets rather than the constant Bearish Narrative of markets dropping And looming recessions and things that Basically trigger the Bears all right Enough with that said this is a Family-friendly fun time Channel last Thing to note there is just 24 hours to Go for the Aussies the triple bonuses Expire today with swift X link in the Top of the video description all right Guys so let's hit up Bitcoin got a lot
To get through with BTC what's happening Over the last 24 hours and of course We'll get into the stock markets because That is part of the overall cycle here This was a chart that I presented to you Guys earlier this week or last week so In a recent video just looking at the Sections of a bull market for BTC Basically we have six sections here so That's the one two three four five six These are broken down into six month Periods you can see we did it again in The previous bull market and we're Breaking it down as we look forward into This current bull market now I Understand that that does trigger many Of the Bears expecting lower lows or Expecting 15 or 16k to be tested I've Stated many times before as I have done Throughout the bottom the reasons why I Don't think this is the case why I think The probabilities are not on their side For a retest of 15K and for now it looks Like we are still in the midst of Testing the low to mid 20 000 range so That is all part and parcel that's a Normal part of this game as we can see From the last six month periods spanning Over this first and second section of This next Journey this next six by six Months so basically three year Journey Here So looking at the first to the second From the previous cycle basically it
Just is a trading range we often get a Few little breakouts to the upside like We have seen here in the first range in This occasion and we also saw it in the First range from the previous cycle of 2019 but in the 2015 cycle we didn't see That breakout till the second range but Nonetheless it's basically a trading Range underneath the old all-time high For the first three periods so basically About 18 months and that leads us into The halving event which is coming up in About 12 months time at the moment the Data is listed around April or May of 2024 so it gives us just under or around 12 months to go until we hit that Halving from that point it's typically Marked only for the last two cycles so Not a lot of data but typically what has Happened is that that's approximately That midpoint in the three-year Journey To the peak and then the approximate One-year Journey into the load now we Know that the bear Market can be 360 Days in the case of 2018 uh last bear Market was about 370 to 380 days and Then the previous bear Market of 2014 Consisted of about 410 days 411 days There so there is a breakdown here of Approximately 12 to roughly 14 months Nonetheless we're on a macro time frame So you have to have a little bit of Tolerance here so this is what I Presented to you in the last week just
Looking at the data what we could expect Potentially over the next 12 months Where we continue to Trade in a Range underneath the old All-time high I don't think that's going To be new to most people I don't expect A new all-time high in these next couple Of ranges would be lovely if it did but Nonetheless the history doesn't show That but what the history shows is we're Probably not going to retest the 15 or 16 000 level and I'm even going one step Further and sticking my neck out here And saying we're probably not going to Retest the March low the March 2023 low At 19 and a half thousand because of how Severe the news event was and what the Market did after that event it basically Pumped from that event okay so this is Also coinciding with what's happening in The stock markets the NASDAQ the s p World Markets where we've all seen rises From that crisis and this is typical of A bull market climbing a wall of worry Okay we'll get to that in just a moment So the next thing I've looked at is a Breakdown of the short term so this is Pretty interesting because we got a Couple of Rangers repeating here to the Downside which gives us a bit of help With where we could potentially expect The price to go and how long this might Last and more importantly how long it Might last first up let's take a look at
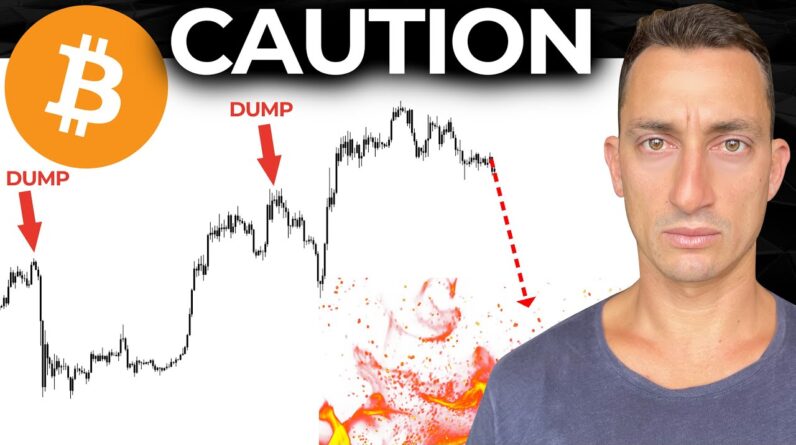
The the short moves here so from the 14th of April top which I noted in Yesterday's video was The exact period of the 2021 April top To the day a two-year cycle repeat to The day I'm not expecting these things To come out to the day every time but The 14th of April that we just saw here Friday 14th and now we saw that first Move to the downside we haven't seen That 14th of April break yet that was Also the peak the previous old all-time High before we got that quick November High and then a plummet from that point Uh through April we also saw a move to The downside after the Bitcoin Conference Miami thing going on here uh In the US and then we saw another dump Into May a pause and then another dump Into June all the while these were Getting a little shorter and a little Shorter and a little shorter to the Downside so essentially the market is Telling you the pressure is running out To the downside not my opinion not this Goofball with a jumper hoodie thing it's The market I'm just repeat repeating and Explaining and reading the book of what The market is telling us so that's what We saw here basically just shorted down Down moves meaning there's less selling Going on and people are finding a better Support at buying up these lows so That's what we've been looking at all
The way back to to June of 2022 where we Thought that this was potentially the Low and if it was to go a little lower It wouldn't be that much lower than Where we were in June so the time still Needed to catch up moving forward to Where we are today basically the Short-term stuff here is that move from April top so we go to the top to the low You can see this was four thousand Sixty four thousand call it forty one Hundred dollars but it basically is a 13 Move now we see the next top to the Bottom we had roughly a forty two Hundred dollar move basically a 13 to 14 Move is this going to repeat maybe maybe Not I suspect it might be a little bit Shorter smaller in that move because we Don't expect the moves to get larger in The move to the downside but nonetheless Let's just have a look at it if we were To do a 4200 move somewhere around 23 And a half thousand dollars takes us out To about a 15 drop to the downside so it Comes in just underneath the support Levels that we're looking for when it Comes to around that 24 to 23 900 level So if we're to get to around that point Just a nice quick flash dump it's only About nine percent away so if you're Looking to get into the market you've Got to weigh up is that nine percent Actually going to happen is it worth the Risk of missing out there are all the
Sort of things you want to weigh up if You're looking to get into BTC e because Now you can assess the downside risk and Figure out how much upside potential There is do we think there is a lot of Upside potential in BTC to go to 60k or Beyond or do we actually think that the Market is going to break this Significant low here at 19 and a half And also take out this low in which case You would then weigh up and say I think There's at least a 27 there's more than 26 percent to go on the downside and Potentially more than 40 percent to go To the downside so this is just weighing Up the probabilities but of course you You've got my opinion here what I think Is going to happen and the way I'm Assessing the risk moving forward in the Market and how I would actually layer in My buy orders based on the analysis I'm Seeing here so I'm just taking a big Look at the short term here lining up Some of the major price ranges all the Way down from 24K to about 27k where you Can see this level just getting tested And then broken down so it looks like BTC wants to consolidate in this Zone Before it mounts another attack so more Importantly we need to look at some time Frames now so the time frames from the Previous bull market and bear Market is A going to be a deciding factor here we Need to understand how much time there
Is in one of these moves to the downside So taking a little look here at the Previous all-time high to the bottom you Can see there was 10 weeks if we stretch It out to that higher low you've got 14 Weeks so it's just important to note Both of those because they are coming up As repeating patterns throughout the Bear market so the next push to the Downside was the all-time high the November High to the low in January that Was 11 bars so we're on a bar chart here Whether you look at bars or candles it Doesn't matter it's the count that Matters it's the number of weeks here so About 11 to the downside then the Significant top here that was the first Lower monthly swing top before the Market collapsed through the lunar UST Collapse and the C5 collapse again a Repeating time frame here of 11 weeks Next we have the FTX collapse and the Jackson Hole Symposium where Powell came Out with his speech collapse and that's All the market could do was a shorter Move to the downside so you can see the Timing is relatively the same you take It to the FTX collapse which is 12 weeks Take it to that final low which is only A few bucks lower 14 weeks so important To note both but the move to the Downside Wait relatively equal but then Got shorter and shorter to the downside
So you can see here if I take it off log Here is your first move here is your Second move now it's getting less and Less to the downside so there are a few Major things to note if we look forward To where we currently are you can see These moves to the downside have been Very very muted compared to what they Were in the bull market so this is quite Typical of what I put it out in the First chart where we're looking at the Different sectors the different phases Of stages of the bull market that Three-year move from the low to the high And then you have the other one year Move to the downside so looks like we're Coming into the second and third at the Moment they're all looking like they're Trading underneath that range and those Moves to the downside Can be measured as well so the previous Cycle you can see some of the similar Numbers coming up here you've got a 12 Week move to the downside a shorter one Here of eight weeks you've got a big 12-week move to the upside and this one Is just to note the the speed of this Move which this was the covert pandemic Collapse and uh this basically happened In four weeks so basically a half time Frame from the other Cycles you've got Eight weeks and a third of the 12 weeks So important to note these levels and as We continue to climb up into the bull
Market it'll be important to note the Pullbacks on the way up just as we did During the bull market we've Specifically covered these for the uh The 8th bull run as well which worked Out really really really well so to Where we currently sit six weeks we're Approximately halfway through each of These Cycles 11 11 11 12 and if we Extend those out to those bottoms then We can see they're approximately 14. so Potentially in the next one to two weeks We will hopefully get a decision on this Low so we got a target for the price Range somewhere around that sort of 24 To 27ish and also a target for the time Frame this is going to be a massive key For us so keep these in mind come back Understand this follow us on Twitter for More updates on this cycle analysis We're looking at price and time targets That is is a big one that most don't Even look at they don't look at time Because they don't believe it's possible But like you can see the market keeps Giving us cycles that repeat over and Over again all right on to the Dixie Just a quick update because we've Covered this many times before you can See Bitcoin has been holding out Relatively well we've basically been Sideways here maybe we'll get a little Bit of a dump here but so far it's been Holding out relatively well for the last
Three weeks meanwhile the US dollar has Been climbing for the last few weeks so There is a Divergence here which is Different to what has happened in the Past I'm going to say completely Different but you're seeing some Strength in the US dollar while the Price of Bitcoin is relatively stable Compared to it so it seems like there Might be some more strength in Bitcoin Once the US dollar finds some resistance And so we can see some resistance a Little further up around 105 up to this Top price here at around 106. so you can Break it down a little further and go to 105.8 or 105.9 nonetheless just keeping An Management number here at 105 to 106 That's our next target range to see Whether we get some sort of rejection Here for the US dollar remember we're Calling a bottom here because of the Technicals and because of the Fundamentals the news was ridiculous at This level saying that the market had to Fall the news was ridiculous at this Level saying the market had to rise Everyone was on board but there were Previous resistance levels sitting Around 117 based on historic data as Well so marrying in the technicals and The fundamentals helps a lot to identify Whether we are actually going to Collapse or we're going to move up and You know we've called that one pretty
Well spot on as well this brings me to This huge quote the worst crime that an Analyst can commit is remaining bearish In the face of a rising market and this Was said by Richard Russell Richard Russell was a Dow Jones Enthusiast Basically he's known here for his calls All in stocks in 1960 called the top of The great bull market in stocks in 1966 And announced the end to the Great Bear Market in December of 1974 so he was Around in those earlier days here you Can see the life that he led there from 1924 to 2015. American writer on finance And so I really love that call there the Worst crime that an analyst can commit Is remaining bearish in the face of a Rising market and that's basically what We continue to see here with the NASDAQ A rising market from October and yes the Calls for recession have been pushed out Further and further and further first we Heard the recession had to be here then We heard the recession had to be in the Uh the first half of 2023 we've got one Month to go now we're hearing the Recession has to be in the second half Of 2023. it honestly doesn't even matter About the word recession we've seen a Technical recession in the first half of 2022 with two quarters of negative GDP We have seen a recession in 2000 and 20 With the pandemic dump so we've seen Essentially two recessions in the last
Two years and people still want a third Recession Like this quote says from Richard Lyon Russell uh here is my quote the worst Quran that an analyst can commit is Remaining bearish in the face of a Rising market and these guys the macros Anyway who continue to remain bearish in The face of a rising market You know what my answer is here Basically NASDAQ it's highest price in 400 Days this is on the back of Nvidia Short sellers losing 2.3 billion in one Day as stocks saw yes I'm not laughing At people losing money I'm laughing at The fact that people continue to try and Short these markets when they are going Up this is NVIDIA right now and they've Been shorting this thing on the way up Which is a very very dangerous game to Play and I'm not here to tell people to Play dangerous games I'm very Conservative and very safe in the market Which is why I continue to follow my Swing chart and just follow what the Market is telling me this thing blew Through all-time high prices absolutely Destroyed these guys and if they were in Shorts here trying to you know take as Much as they could from the market that Will wipe out their accounts you cannot Hold into that and and uh hope for the Best if you are shorting the market so That's what's happened here Nvidia short
Sellers lose two point three billion in One day a stock saw the game pushed Short sellers in 2023 paper losses to 8.1 billion so there might be a lucky Few who are just doing 2X or maybe 3x on Their shorts but if they're 10x you Cannot hold into a move like that at a 10x without putting more money in or Just basically wiping your position out Entirely so Is this a problem is this a problem for The NASDAQ stocks uh because there's Only just a few of them pushing the Market up that's a common question as Well and we've covered this many times Before on the channel so make sure you Do like the content so you see it Subscribe and obviously share it with a Friend as well we've covered the reason Why it's not an issue if the NASDAQ is Rising with a few stocks pushing it up Same sort of thing for the s p this is Basically this was a narrative weeks ago Where a lot of analysts were trying to Call this a problem because they need The whole Market to rise in a bull Market that will come early on the cream Rises to the top the cream Rises to the Top then people take some of that cream Off and they throw it onto a pile of and the pile of is the rest of The market same thing happens in crypto The cream Rises to the Top early on Bitcoins your ethereums whatever altcoin
It is that you've married then you and Me we all take a little slice of that Frame off the top and we throw it onto Some like Pepe or Doge or any of These other meme coins maybe Ada and we Wait for those things to go up in value As well that happens at the end of a Market so if you're worried about the NASDAQ or the S P Rising on a few stocks Don't be this is what happens at the Beginning of markets now I'm not saying That the Nvidia is going to hold out These levels forever that looks Obviously overblown maybe it comes back Down fills the Gap will wait and see Right but the point is that these Markets will rise like I've got here as Apple As an example they'll rise on the back Of a few strong players because these Are the cream of the market all right Guys last note here my friend here Akil He'll be on the channel he works with Phil Anderson with the property share Market economic company he has just Released his book it'll be out in July So I'm just giving a quick shout out to A Kill I'll get him on he knows a hell Of a lot about the 18.6 year economic And real estate cycle just thought I'd Give him a shout out and maybe if you Want to go and purchase his book you can Do so links are here I follow him go and Check us out on Twitter as well that's
It for today's video huge update again Explaining what's going on what I expect To happen in the next couple of weeks I Hope you found some value I'll see you At the next video stick around on Twitter I'm doing a live space with with Eric Crown this afternoon on Friday Otherwise I'll be back here with a Another video in the coming days until Then have a good one peace out