🏆 Free Crypto & Economic Report Emailed To You:
👾 Free TIA Community Discord:
📈 TIA Gann Swing Indicator
🔥 TIA Premium! Trading Courses & Exclusive Community
▶ Subscribe to the channel for more macro market analysis on Bitcoin, Crypto, Stock Markets and Real Estate Cycles.
UP TO $38,755 FREE! Crypto Exchanges
🥇 ByBit Free $30,030 + 0% Maker Fees (NO-KYC)
🥈 Bitget Free $8,725 (US + Global Users NO-KYC)
🇦🇺 Swyftx, Best Australian Crypto Exchange
▶ My Official Socials ◀
YouTube
Instagram
Twitter
▶ My Must-Have Crypto Resources ◀
Education – TIA PREMIUM MEMBERS, Trading Courses & Exclusive Community
Charting – TRADINGVIEW ($30 Off)
Storage – LEDGER
Tax – KOINLY (20% Off)
Trading – TIA GANN SWING INDICATOR
Channel Sponsor: New Brighton Capital, Aussie SMSF specialists. Book your Free consult and use code “Pizzino” for $200 credit off:
This video is for entertainment purposes only. It is not financial advice and is not an endorsement of any provider, product or service. All trading involves risk. Links above include affiliate commission or referrals. I’m part of an affiliate network and I receive compensation from partnering websites. #crypto #bitcoin #cryptonews
Bitcoin Shrugged off the Doomsday News Of the last two weeks with banks Collapsing in the U.S further interest Rate Rises and the fear of impending Recession these talks have been going on For nine months now and if you remember Back nine months ago that was the June Low in Bitcoin and for the s p and for The NASDAQ since this time the markets Have been extremely bearish yet we are Not seeing the same sort of bearishness In the price chart the price chart is The facts of the market this is where we Go to find the real data not from the Headlines and not from the noise that's Going on out in the news media around Yield curved inversions and further Bank Collapses which is how other crises have Started in the past what we want to look At today is the objective data looking Specifically at macro green signals on Bitcoin each time these have happened in The past the market has already put a Bottom in so this is further Confirmation that the Bitcoin low is in And that any downside that we see in the Market could be a fantastic dollar cost Averaging opportunity basically the old Buy the dip is back now I've got these Major signals to show you that work on Bitcoin cryptocurrencies and most Importantly traditional markets because There's no point in using indicators That just work for Bitcoin we need
Indicators and signals that have been Tested over decades in fact these have Been tested over 100 years using Gan Analysis and that is the specific Technical analysis that we use at the Investor accelerator so quick shout out To our free crypto and economic report We put exclusive content into our Newsletter that comes out once every two Weeks so there is a ton of detail in These newsletters stuff that we don't Put on our videos and only things that We can look at with writing and charts So that you can get the most out of what Is actually happening in the market You'll find and a link to this free Report in the top of the video Description so sign up to that and you Get it sent to your inbox once every two Weeks and while you're at it hit that Like And subscribe button don't forget About those okay so Bitcoin massive Green macro signals that basically Confirm the bottom is in we obviously Have a couple more that we are waiting For but in this video I just want to go Through a macro one which is relating to The monthly candles of course you can Use the bars which I also prefer but Candles are showing this a lot easier It's very it's much easier for the eye To see this now much still has seven Days 22 hours to go so essentially eight Days and of course it's cryptocurrency
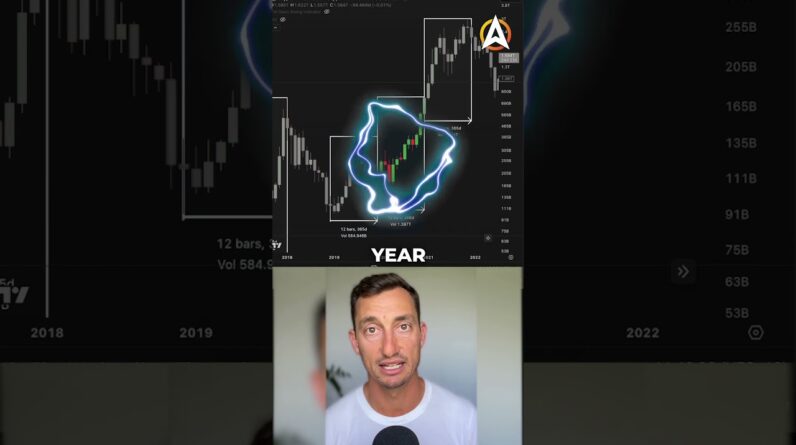
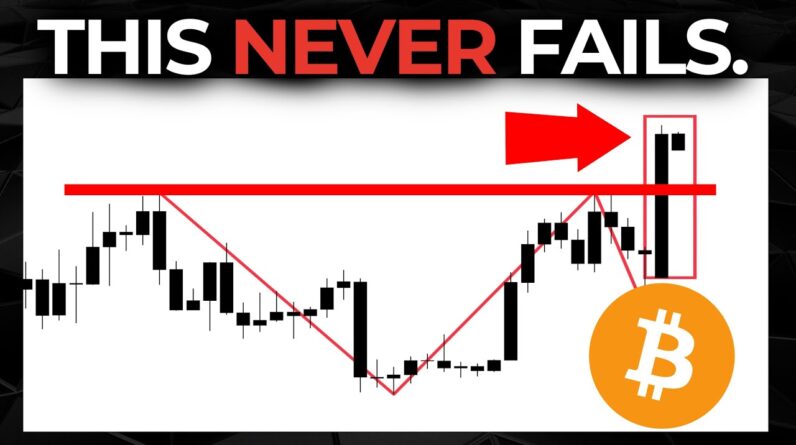
Anything can happen but if you've been Following the channel you'll note that We have made a lot of content and a lot Of analysis about many many macro bottom Signals that have come out over the last Several months this is just another one That I want to add to that toolbox of Yours and hopefully you're building that Toolbox for your trading and investing Meanwhile the rest of the market is Anticipating further downside and this Is getting further and further away from The truth now enough of my Rambles let's Have a look at this particular signal Itself and we can go back through Previous Cycles to have a look at just Exactly when these have come out come up We saw one in January but I want to take It to March because we're really Starting to see this Market push away From the lows on ever increasing volume Which you know we've covered many times Before on the channel most recently was Yesterday and this also comes up on s p And every other Market because Essentially it's just showing you where Buyers are coming in But this is really looking at where Those accumulation levels had formed and Then we look for that breakout on the Monthly candles and so we can see the Monthly candles here in the case of April of 2019 in July 2020 another one Here in October 2020 as they attempt and
Actually confirm a breakout of an Accumulation Zone and that's precisely What we have just seen right now we're Eight days from this but the uh the Market dropped into June and we're Basically looking to close above these Levels so I want to have a look at this How this is formed every single time and How the market has already bottomed how Far back the market had bottomed from That point and basically a look to the Upside from here so January is basically The most recent one but we we want a Little more confirmation of the signal There which is why we're waiting for March to close and if it does in fact Close we want to see it close above 25 300 so that's another key level which is The tops of August and for February Now going back into 2020 this is the Reaccumulation Zone before the market Broke out into that final run of the Major Bitcoin bull market the pullback And then the push again you can see Again there is a clear Resistance level Before the Market's able to break out And form another higher low now we can Take it one step further and go to the October 2020 where the market then again Breaks out of all of these tops that's Why we're focused on 25 300 as a key level for Bitcoin to Maintain over the next eight days to
Close above to confirm this massive Green signal we saw it in January nice Push-up the previous Bitcoin bear Market Low consisted of four months of Accumulation before we then saw that Breakout month and so when that month Closed above that accumulation range There was obviously a nice big run from That point it's essentially the Bulls Letting the Bears know that they've lost And that they are about to get destroyed To the upside but we're still early days In that cycle so we're not going to get Too excited to think that we're going to Go to new all-time highs from that Particular pump the Bears will have Their day again they'll get excited and They'll most likely get a nice pullback From wherever ever this top comes in That's going to be a good time for the Bears another good time for entering Into the market but essentially we don't Want to keep buying all the way up into The pig because things can get very over Hot and overheat it so this is going to Be the time where the Bears come back in Thinking that they have won the show and We're going to see some further declines Wait to see where that top comes in for Bitcoin could be 30 could be 40. let's Wait and see what happens previous cycle Low in 2015 so we're going back two Cycles now you can see the month here in October 2015 we have the accumulation
Range all the way up to about 290 Dollars before Bitcoin broke and closed Above that accumulation range that again Is signaling that the Bulls are in Control it's broken out of that Accumulation range and it's ready to go On that next stage of the Run there's Always going to be periods after the Balls break out that the Bears regain Control for a brief period of time and It's going to most likely be a shorter Period of time five then any time Previous to that that's the another key Area that we have to look out for when The Bears do get control again because The fear will come out and it can last For like we can see here a month maybe Two months like we saw in 2019 it was uh Multiple months one two three four five Six months before the market really got A push on in January obviously the Pandemic took control at that point but Then the market took off from there and The Bears really didn't get a say again Until the following year in May so the Breakout confirmed by the Bulls as it Broke and closed above that level on the Monthly candles happened again as it Broke out of the reaccumulation in May And again in June and of course the Bears took over for a couple of months After those Spike attempts but Nonetheless the Bulls took over because The low was in from that point and the
Market using our Gans ring indicator was Putting in higher and higher lows that's Our ganswing indicator here another look At that is in the top of the video Description so that you can learn how to Use that for your trading and investing To give you a mechanical plan nice and Simple entry and exit strategies now to The previous Cycles this was the bull Market of 2012 and 2013 where it peaked In November of 2013. so starting back at The low we had this bar well this candle Right here in June 2012. here is the Area of reaccumulation or accumulation After that first dump market closed Above those levels here in June and that Was that signal that the low was in this That was it there was no more attempts By the Bears to be able to overcome that Low and push that market down the market Rallied from that point making a new All-time high then we find ourselves With the Bears in control once again This time just for three months we had Re-accumulation before the final Peak The Bulls said enough's enough pushed The market up and closed above it which Is just signal that things are going to Get really spicy really soon this is of Course at the end of that cycle but We're more like in this sort of scenario Right now where the Market's been down For some time and most closely resemble Something like 2014 where this could
Take a little bit more time rather than The ends of the cycle at the peak where You get this quick blow-off move now if You take it off long you can see just How big that move is this was the Breakout Point saying that the Bears It's over we still have another move to Go the Bulls take control that was too Fast too quick but of course a lot of Gains can be made from 200 to 1200 and Down she blows from that point the data Is showing us that this signal is not to Be messed with this is not one of those Things where you can say well if the Market comes back we're going to see Lower lows it is almost 100 Bitcoin Doesn't have enough data to show that But these are those sort of signals that You don't want to mess with to hope that The market goes below the previous low At fifteen and a half thousand or get Even greedier expecting a 12K or a 3 000 Bitcoin which is completely out of the Question there is no three thousand Dollar Bitcoin if anyone wants to take That bet up with me I will gladly take It up with you there is no three Thousand dollar Bitcoin ten thousand Dollars off the table as well but let's Have a look at the timing here enough of The the gambling in our own thoughts of The market let's have a look at at how Long these ranges take we can see that We're four months from the low now but
Going back to the first one here the low To where the breakout month happened Approximately seven months so you can See here we've got seven bars the next Range three bars the next range nine Bars from that breakout now this is also A low here which was two months earlier To where the breakout was but this is The index chart that we're looking at so On many exchanges the August 2015 low Wasn't the final low it was a higher low To January so that's why we're using January in this case but keep both in Mind because they were significant lows During that bear market so basically two Months To the August but the the low we're Using here is the Janu low which is nine Bars earlier the next one we have is Four four bars from that breakout in April to where that low was in December Now of course there's another one here But this is the breakout after the Breakout which we'll get to once the Market starts to uh to break a little Bit higher but we can also measure these From those the cycle lows as well which Again was four months so the covert Crash load to the breakout of all of Those highs you can see the month here In July closed at 11 350 which was above All of these levels everything getting Rejected so the resistance was playing In and then the market broke out of that
Resistance And finally we find ourselves here at Four months you can see a very nice Repeating pattern four months the the Low the breakout previously four months Previously again four months previously Nine months so two lots of four giving You that eight to nine month period You've got three months here so just Short of the four we're talking macro Cycles here and the previous one seven So divide that by two there's three and A half close enough to four this is how We use those timing aspects of the Market like we can see here it hasn't Been broken once we break past these Significant monthly tops and we get that Close seven days 22 hours away from that Point then there has been no other Situation in bitcoin's history that the Market will come back and make a new low Essentially confirming that the bottom Is in we've broken above weekly swing Tops the market is closing above Significant previous resistance levels And that means we are basically on for Another bull market there will come a Peak And we will start to see pullbacks Eventually and maybe they come all the Way back to test those highs like They've done in the past in which case The Bears again will get very very Excited and very very loud meaning the
News headlines and the fear and the Emotion gets really really wrapped up But just pay attention to the Chart if They can't and if the Bears the shorts Can't break past significant previous Resistance which then becomes support There's another signal that the market Is telling you support is in these are Going to be the next entry levels as you Buy the dip and the market will start to Push up again slower at first and at the End it gets faster that's just what Happens because more people believe that The bull market is on the Bears have to Flip because they are wrong And that's why the market speeds up Because everyone starts piling in it's The sheeple at the end of the move that Make the move the fastest now you might Be wondering well if there's still seven Days 22 hours to go why are you so Confident on this well we've had January Break above these previous levels which Was two months from that low we've seen That happen in the past as well we're Also broken past the highs on a weekly Chart which we've also covered here on The channel and in terms of timing over The for the overall cycle we are at that Low point at around that 360 to 400 day Lows we've covered many of the reasons Why we think this is the loan we Typically see the breakout happen after That point rather than looking for it
Early on now I'd be very cautious of Using this same sort of scenario if it Was early on in the bear market so from The Peaks to the downside I'd be much More cautious but because we've gone Down for so long we've broken back past A lot of the the fearful news Announcements like happen with FTX and a Lot of the the fundamental collapses in The market and the price is now getting Back past those that just puts more and More emphasis on the uh the side of the Bulls yet we're still cautious and if we Need another signal here 200 week moving Average it's not one that I use often But it's an interesting one to keep note Of because a lot of the market does look At this particular signal and so we've Seen over the course of the history of Bitcoin it come back test the lows and Bounce away from them now if we clear up This chart here so we can just look at The 200 week moving average you can see That it's used it as support many many Times in this case the first time in Bitcoin's history it broke under the 200 Week moving average used it as Resistance whether you're looking at it On the weekly chart or the monthly chart Resistance and fell away from it but it Didn't last too long underneath this Level I mean nine months is a pretty Good time time frame to be able to be Buying up the dip at the lows but as you
Know many people during this period Where we're looking at lows here June And September and of course November as The market bottoming the bottoming Process many were still extremely Fearful of much further downsides Looking towards nine thousand eight Thousand ten thousand You Name It Whatever the low price was they were Expecting that and continuing to hold on Even though the move was getting shorter And shorter so now we find ourselves Breaking back above testing the 200 Falling away from it on the banking Collapse which is what this March low is And now we've pushed past those prices With seven days 22 hours to go for the Monthly to potentially close back above The 200 week now if we go down to a Weekly chart last week which you may Know it closed above the 200-week moving Average of course in the past it has Done that before and then fell back Under so let's stay cautious and see Whether the market will pull back and Use it as support this time somewhere Around 25 to 26 000 which could be Another good buying opportunity and use It as support to then springboard from To push to higher prices so I'll Continue to update this particular Signal I think it's almost in the bag at This case obviously there's a week to go But we're seeing many many good signs of
The market breaking back above double Tops and everything else that I've Covered here on the channel so make sure You do subscribe like the content have a Great weekend and if you want to get the Crypto and economic report that comes Out once every two weeks exclusive stuff Where we look at the macro Cycles Looking at the the real estate cycle as Well as Bitcoin and cryptocurrencies uh Do use that link here crypto and Economic reports uh sign up to that You'll get that in your inbox have a Fantastic weekend I'll see you guys at The next video Until Then peace out