


🏆 (SIGN UP FOR A DISCOUNT ON TIA PREMIUM BEFORE THE PRICE INCREASE) Free Crypto & Economic Report Emailed To You:
🔥 TIA Premium! Trading Courses & Exclusive Community
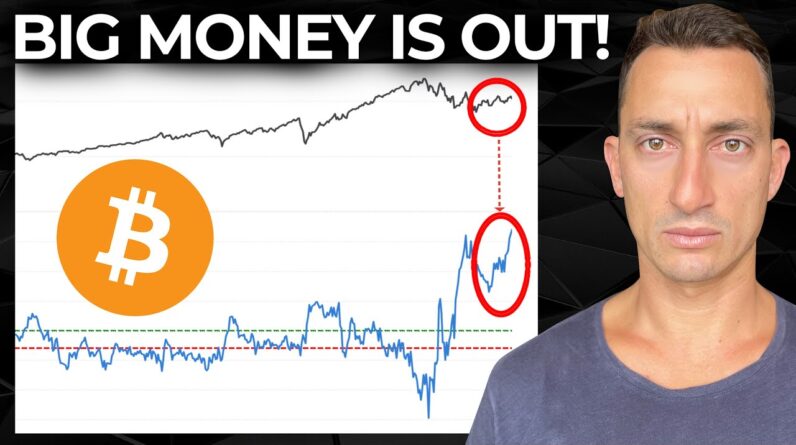
In this video we discuss why Big Money isn’t betting on a bull market for SP500. We also cover SP500 Energy Sector hitting new 1-month lows and what this means to the bull or bear market.
Remember to subscribe and share the content with a friend if you find it valuable to your investment knowledge. Thanks, Jason.
****************************************************************
LIMITED TIME – 16th May 2023 – FREE $230 USDT with ByBit & Bitget (No Trading Required):
🟠 Bitget Free $8,725 (US + Global Users NO-KYC)
▶ New Users: KYC & Deposit $100 or more to get 10% Cashback (up to $200 cashback in USDT)
🟠 ByBit Free $30,030 + 0% Maker Fees
▶ New Users: KYC & Deposit $100 or more to get $30 USDT bonus plus 0% maker fees for the first 30 days.
****************************************************************
UP TO $38,755 FREE! Crypto Exchanges
🥇 ByBit Free $30,030 + 0% Maker Fees:
🥈 Bitget Free $8,725 (US + Global Users NO-KYC)
🇦🇺 Swyftx, Best Australian Crypto Exchange, Limited Time $20 Free BTC
▶ My Official Socials ◀
YouTube
Instagram
Twitter
▶ My Must-Have Crypto Resources ◀
👾 Free TIA Community Discord:
📈 TIA Gann Swing Indicator
🏆 TIA PREMIUM MEMBERS, Trading Courses & Exclusive Community
🐂 TRADINGVIEW ($30 Off)
🔐 LEDGER (Limted Time $30 Free BTC)
👨🏫 KOINLY (20% Off)
This video is for entertainment purposes only. It is not financial advice and is not an endorsement of any provider, product or service. All trading involves risk. Links above include affiliate commission or referrals. I’m part of an affiliate network and I receive compensation from partnering websites. #crypto #bitcoin #cryptonews
Markets have taken another hit this time The news narrative is Shifting towards Energy stocks it's shifting towards Banking collapses it's shifting towards Big Money sentiment so what is actually Going on let's take a look at what is Happening in the macro markets how this Is affecting Bitcoin and of course smash Up that like And subscribe button Terrible Segway but I hope you are Getting some value from these videos now At the end I'm also going to give you a Major tip when it comes to these sorts Of charts and the different narratives That continue to flip around time and Time again throughout these markets I Want to leave that to the end so we can Get through the analysis first the other Thing top of the video description is Our Tia premium this is the stuff we go Through with our members once a week and In full detail on our weekly live Streams this stuff helps you get a Clearer picture of the noise in the Markets and put together the pieces of All of the Cycles the real estate cycle Stock market and of course Cryptocurrency so I'll leave that top of The video description but for now let's Crack on with what is going on in the News and how the narratives shift now This comes to my attention which is a Fantastic thing from you guys all of you Watching because you're starting to pay
Attention to what the macro indicators Are what these macro indicators are Trying to tell us this was a particular One here on yesterday's video that it Mentioned to me that the smart money Movements for s p there are charts to This this isn't a guess it's charts Etc So that's where this is coming from and I want to explain that towards the end Of the video as we get through the Analysis so enough of the rambling what Is the first piece here before we get to That big money or in the case of the Comment saying the smart money so the First piece is the energy sector stocks Now there's an easy way that news Narratives can shift when they take a Piece of data and decide which time Frame they want to emphasize and put a Big disclaimer or a big collapse apps Setting or warning on right this time We're looking at the energy stocks and The main thing here is that we're seeing New one month lows for energy stocks so This is putting a fair bit of fear into The market and people think oh this is Just the beginning and the market needs To collapse further as always we want to Have a look at the data and what this Data point means the important thing to Note here is it is just one data point And you probably figured it out yourself What the hell does this have to do with The entire Market itself or even Bitcoin
We'll get to that in a moment but Essentially with the data over the last 70 years when the stocks in the energy Sector close at one month lows exceeds 84 so more than 84 of the stocks are Closing at one month lows in 15 days or Fewer of a six week high of the sector So we had a high within 15 days 80 are At new lows what does this mean well Downside more downside begets more Downside that's just the trend two weeks Later the sector closed lower seven out Of 10 times so just means that the Energy sector is going on a downtrend But what does this mean longer term well We can see from three months later It's seven out of ten times it's up so From two weeks later it's down this is The positive returns so only three out Of ten are in positive and seven out of Ten are in negative and then we go to The three months later and it's flipped On its head you've got seven out of ten In positive and three out of ten are in Negative six months later you're at 85 Percent and then 12 months later you're At sixty seven percent So eventually it All catches up and I'll show you that in The chart itself so this is the S P 500 Energy sector SPN if you want to search It yourself there is Cycles so Cycles in Markets all across the board that is What we as humans are made up of the Entire universe is made up of Cycles
There's nothing we can do about it apart From learn what they are and see if we Can get it to tune with those Cycles so For the energy sector it has been up for 32 months I'm on a monthly chart here Looking at the lows to the highs Typically we see 33 months we see 70 we See 60 three so there are some pretty Significant numbers to the upside we've Got 32 at the moment we had 33 in the Past from this low to this high and if You double these numbers you get around 64 maybe 66 close to that 70 point and We can always just move this to this Next significant loan you got 64. Basically the point before the market Took off so this is all of the energy Sector so maybe we've just gone through A half cycle of one of these major Cycles so what do we expect to the Downside well in the pre in the past you Got 19 bars that's 19 months you've got 10 months you've got 17 months where are We currently at well we're about six Months down so 10 months from this point Takes us out to about September and we Go 20 months out you know that Middle Point takes us out to about July of 2024. so these are all macro Cycles when It comes to the energy sector and like The data showed in a couple of weeks the Short term which is what retail Typically focuses on or the new investor I guess or the new use itself yes
There's going to be more losses but in The longer term there's going to be more Positivity in the gains and that's just Coming from the data here on the S P the S p energy that is as for oil same sort Of thing here that's the major one that Makes up this energy and it's on a Two-month uptrend it's had its uptrend Into the Russia War now it has come back About 12 to 14 months hitting on the 50 Level so these are all just Cycles Within Cycles looking at the short term Looking at the long term and when we Take these single data points there is a Very big area of failure in our own Plans trying to make out what is Actually going on that's why I tend to Stick with the same sort of things over And over again again swing indicator Again 50 levels and Wyckoff itself Looking at the volume and the tape Reading of the chart so I always go back To the facts in the charts what is the Money actually doing not what the news Headlines are pulling from particular Data sets whether it's short-term medium Term or long term you've got to Understand which time frame we're on so There's part of your trading and Investing tip for this video now Over to this particular comment here Which I've seen a lot of which is a good Thing okay so hit up that like And Subscribe get down in the comment
Section I usually leave a good comment Down there as well so we're starting to Make this a little bit more interactive We've got a lot of learning in here What's coming next so that we can Decipher through the noise in the market And then you guys let me know in the Comments section what you think is going On next but in terms of this particular News piece this next news narrative when It comes to the big money big money Sentiment stays low meaning there is the Big money getting out of this they are Unsure of what's Happening next the big Money isn't buying the rally the big Money isn't betting on a bull market and This typically comes through here as Well showing that smart money movement For s p they're all getting out at the Moment maybe so but they have called This wrong so many times and so it's not Necessarily that the big money always Gets it right because at the end of the Day the big money is taking money from The other big money and don't need the Small money they're looking for big Money and there's a difference between Big money and smart money so that's what We have smart and dumb the dumb money Usually goes to the smart and that can Be between the big money and the big Money as well they're playing in the Billions hundreds of billions tens of Billions maybe hundreds of millions
Right that's not what retail is playing In but there is going to be dumb money In big money and smart money in big Money as well so although big money Sentiment is staying low it doesn't Necessarily mean that the market is Going to collapse overall there was a Moderate bullish tilt to the S P's Forward returns after a pessimistic Sentiment from this group so overall 12 Out of 15 times it was completely wrong There were a couple of significant Losses so they got those right so it's Not the worst indicator that we've ever Come across on the channel here but Again it's still not something to live By just like the rest of these data sets It's not that you can use one particular Data set to help you forward you need a Consistent full structured plan around Something like a swing chart to let you Know Trend Direction something like Volume to let you know what the money is Actually doing something like a 50 level To give you an idea of where profit Targets are and extreme levels are in The market so back to looking at this Big money sentiment the back testing the Data points here this is the spread Between the Bulls and the Bears when It's at its lowest levels and what Happens moving forward across the next Week later or the one month later or Even the one year later so one week
Later when this is at its most extreme You can see it's about a 50 50 split so Nothing that you can really work with But as you get further into the time Zone the time frames here two months Three months six months 12 months in Particular your two months your six Months and your 12 months you can see That there is an upwards tilt to the s p And that's pretty much the history of The stock markets they tend to go up so It's just a matter of the timing if we Look at the timing when these particular Data points have come out this has been Near the peak so that's a good one there There was also the peak here in around 2019 before we had the pandemic collapse There were several more months to the Upside but nonetheless they're big money They need to start to sell out before The exact Peak so can't hold it against Them there but then you have these times Here just before the market peaked so Not a bad call but then you got bad ones Here way at the bottom bad ones here way At the bottom more bad ones here way at The bottom so this is two of them Another one here as the Market's heading Up it's at the bottom you've got a long Time to go before any sort of Significant collapse and again in the Middle of the run here 2005 we still had Another couple of years left and so it's Not the most perfect indicator but I
Have to say it's not the worst indicator That we've seen on the channel either Other measures suggesting large Trader Hesitancy so large investors aren't too Keen on stocks taking a quick look at The major index combined hedger position This is basically the combined dollar Value of hedger positions in the s p the NASDAQ and the Dow Jones so all of the Futures markets here in the US so Anything above the green line Is pessimistic it's the opposite okay When you think of green and red anything Underneath the red Is excessive optimism as it says down Here for the extreme values so above Extreme pessimism they've been Pessimistic at the lows And underneath as you can see right here They've been extremely optimistic that Is at the tops so it's almost in Complete opposite anytime you go back Through this chart you can see that There is Extreme pessimism at the Bottoms then you have extreme optimism As the market is trending up So this continues to head further and Further into pessimism which potentially Over the course of the next few months To a year is going to lead the s p to Higher prices just like we see with the Other data and what we've been covering Typically this back testing shows over The first few weeks you don't really get
A clear reading But as time goes on you Get a much better reading and you start To see that these gains are to the Upside so keep that in mind if you're Ever looking at these data points it's Not the next day or week or month Typically it's several months to maybe a Year or two so that's what we're seeing On the S P right now just range trading Between the levels that we've been Looking at around four thousand four Thousand and sixty to these highs here At around 4 200 points so the question Now is is this week going to close out Lower or higher the main thing that we Need to focus on is is it going to close Above 4000 which is this 50 level right Here now we've got the banking crisis Low uh well and truly down here at 38.40 so that's still intact and the Higher lows continue to form so for now Nothing too much has changed yes they Are selling at the top but the lows Continue to get higher so let's take a Longer term perspective here and keep uh Keep our heads about us when any of These short-term news items come up like The Regional Bank sector collapsing so I Put this on Twitter if you're not Following go and check that out down Below links are all here for my official Socials don't get scammed out there from Those fake accounts across Instagram Twitter Youtube telegram wherever it is
These are my only official links right Here so the regional banks will collapse And that was the news that was a Narrative yesterday today we see the Smart money big money uh saying that There well at least the data shown They're selling off we're also getting The energy sector stuff which if it Comes through it does if not you're in Front you get the idea of Um what's going on over there for the Energy sector itself In terms of the regional Banks I would Say that this is very similar to what we Saw in crypto when the SEC went after Those other crypto exchanges that no one Had never heard of it latso comes to Mind bixi B A b-e-a-x-y it's the same Thing except now it's for regional banks No one's even heard of these Regional Banks if I have a link to it somewhere Here we go p a c or Pac West uh there Are all these Banks here Western Metropolitan it was just like it was a Complete show and everyone was Freaking out about this but it's the Same thing over and over again it's the Same narrative I guess that's why I have That that tone in my voice where it's Like the same thing we see time and time Again and it's history and we just don't Learn from it and people get scared About the same things or they say don't You know that this is happening and
You're like look it's happened so many Times before and then if you go to the Chart the downsides are getting less and Less here's your banking collapse and Now here is your Regional collapse it's It's it's next to nothing in comparison To what we saw over the inflation fears And the interest rates as we covered in Yesterday's video So you've got everyone on social media Going on about this Regional Banks Failing and it's so important and They're all the same you know regionals The same as the big banks no they're not All these things can go down and JP Morgan that has nearly 4 trillion in Assets under management is still bigger Than all of those Banks so it doesn't Matter it really does not matter that's Why I say it's it's basically laughable Because we've seen it so many times Before forget the noise focus on the Macro cycle it Still Remains bullish Until we see some of those indicators Drop and we will see some of those Indicators turn like we do at the end of Every cycle so just as a reminder here We're somewhere in this Zone at the Moment before we get to this really fast Winners curse stage where everything Starts to go a little crazy and before The major collapse and someone asked Where are we at in the major collapse What happens in the major collapse it's
Approximately four years maybe about six Years this is for the real estate cycle Of course for the stock market you might Get a nice Spike down and I might Spike Up in in a matter of two years like like What has happened in the past but we Don't know yet let's wait till we get to The peak first which is why we need to Stay very Vigilant right now because we Are coming towards the end of this and There will be some sort of very Significant collapse not just what we've Seen over 2022 which seems quite Significant but I think things are going To get a lot worse after we see some Sort of bull market this is for the Stocks this is for crypto Bitcoin and Real estate I'm not a permeable I'm a Bull while the markets say up and while The cycle is still up we are going to Get a very big collapse going forward But we still have a few years left in This particular cycle and as for Bitcoin We can see that the cycle has really Just begun I do understand that there Are still many people calling for a lot Further downside to break past the 15K Low but that's pretty much all but gone So that's the missed hope the missed Opportunity as I've pointed out before Especially under around that 22 or 19 And a half thousand dollar level we've Been up for several months we're going To need some sort of plateau time soon
But we may start to form something like We did in 2015 2016 well we got a bit of A breakout and then sideways for several Months and another breakout and sideways For several months this is going to put A lot of pressure on those Bears where They're hoping and expecting further Downside so they keep the narrative Rolling over waiting till the end of the Year waiting till something else because Essentially they would say well my Bearish narrative hasn't been Invalidated yet and that just going to Keep pushing that higher and higher Eventually we'll get to the double top And they'll potentially say well here Comes the bearish narrative it could Happen but in the meantime going from 15K to past sixty thousand dollars is Four times your money so it just depends On which Camp you want to be in on which Time frame for now the trend is up the Monthlies are up the monthly swings have Been broken and it seems like anything Underneath approximately 19.5 to 22 000 Is most likely a missed opportunity from The Bears that's a current look at the Narratives that we have been seeing over The last 24 hours things seem like They're now shifting to the energy space Just after they went from the smart Money big money whatever the headlines Are at the time moving towards the Regional U.S banks there's always
Something new there's always a new Narrative but if we keep a broader Picture a macro view with our indicators Some nice simple stuff like we teach at Tia premium Links of course are in the Top of that video description then you Can start to reduce that noise and Become a macro investor along with Potentially a short-term Trader as well To bring in those profits and know where To put them longer term I'll leave it There after you hit that like And Subscribe check out the comments down Below and let me know your thoughts as Well until the next one take care and Peace out