
💵 Subscribe for Our FREE TIA Trading Guide + Free Crypto & Economic Report :
🔥 TIA PREMIUM MEMBERSHIP: Trading Courses & Exclusive Community
Please subscribe and share the content with a friend if you find it valuable to you. Thanks, Jason.
UP TO $38,745 FREE! Crypto Exchanges
🥇 ByBit Free $30,030 + 0% Maker Fees
🥈 Bitget Free $8,725
🇦🇺 Swyftx, Best Australian Crypto Exchange, $20 Free BTC
(Disclaimer: Swyftx, ByBit and Bitget are channel sponsors. All decisions you make are your own.)
▶ My Official Socials ◀
YouTube
Instagram
Twitter
▶ My Must-Have Crypto Resources ◀
👾 Free TIA Community Discord:
📈 TIA Gann Swing Indicator
🏆 TIA PREMIUM MEMBERSHIP, Trading Courses & Exclusive Community
🐂 TRADINGVIEW ($15 Off)
🔐 LEDGER Crypto Wallet
👨🏫 KOINLY Crypto Tax (30% Off)
This video is for entertainment purposes only. It is not financial advice and is not an endorsement of any provider, product or service. All trading involves risk. Links above include affiliate commission or referrals. I’m part of an affiliate network and I receive compensation from partnering websites. #crypto #bitcoin #cryptonews
As we approach the Midway point to 2023 Let's take a look at prices that Bitcoin Will never see again using data the Facts from the charts for BTC over 12 Years of history and of course the mega One the S P 500 over 100 Years of data As well we want to stick to the facts Here not the opinions not the subjective Views just the facts from the charts Make sure you hit that like And Subscribe and if you want to join our Members just checking out the community Our Tia community and Discord scroll Down in the video description there is a Link there to get your invite join Nearly 5 000 members in Tia crypto and You can also start to see some of the Results there The Goods the bads and the Beginners one week into Tia premium and They are making some good little gains Over there profit is a profit so that Link again scroll down free Tia crypto Discord you can check out some of the Free content in these particular Channels up here all right guys this is Your home of macro cycle analysis Studying the past to forecast the future We obviously do our absolute best to Cover crypto Bitcoin real estate cycle And of course the stock markets as well Today's video I want to have a look at The monthly returns for BTC and of Course cover those prices that Bitcoin Will never see again just wanted to
Stick to the facts on the charts I know It's a huge title to live up to Personally I don't like words like never And impossible and things that are Absolute in trading or investing because You know anything can happen I'm just Going to use the data from the charts And just look at some prices which Bitcoin has never reached and probably Will never reach again but also look at What we can do if some of these prices Are reached I said I'm going to look at Prices that are never and of course There's going to be some that may be Reached all right So we're coming up to the midpoint of 2023 That's halfway remember we still have Calls from many pro Traders and Investors in the markets and analysts And news media and whatnot that they're Still bearish in the market absolutely Okay nothing against that I just want to Stick to the data in the charts now Those particular calls are probably Getting a little bit worn out at the Moment they'll come back they'll come Back in full force when we get some sort Of Correction and if that's the case I Want to show you how to take advantage Of those situations now there's been a Couple of videos that I've put out here One in particular is going back to April 13th and I also have another one here on
March 7th which was before the banking Collapse looking at profits looking at What could happen to the s p and to Bitcoin in 2023 with much much bigger Upside and this was while there was far More bearishness going on as you can see Here we had a bear Market uh rally call From the global fund manager survey There was about 7 27 of fund managers were saying now that This was a bear Market rally how wrong They were at the time so the same sort Of thing goes for BTC so I just want to Start with the six monthly as we close Out another six month period and Remember those calls for recession have Now been pushed to the second half of 2023 you know if you don't get it in the Second half of 2022 push the calls out To first half of 2023 if you don't get It in the first half push it out to the Second half and you you can see that This will continue on and on and on and Become less and less and less like the Noise will be less about the recession Or at least downside collapse because We've seen in Germany a recession and New all-time high prices so just because As a recession doesn't mean we have to Get lower prices all right so this is The six month chart of BTC let's just Look at the lows and the highs of the Bar This is an interesting one because we
Have a couple of options here so Remember these are six month bars it Takes a lot of data just in one of these Bars I know some people prefer candles I'm going to stick to bars because That's how I learned to trade we have This bar right here it's a Higher low we have a higher high as well And we've started to put in a green note The bear markets we have two red bars Next bear Market well the previous bear Market in 2018 two red bars we also had Three red bars in this case for the 2014 Bear Market but that final bar was a High-ish close we zoom in that was a a Pretty decent High close there the low Was 163 dollars with a top of 320 and The closest in the top half of that bar So the pressure was running out towards The end of that move nonetheless three Red bars now the only other period was a One red bar in 2011 and then this other Red Bar here which was a lower high and Higher low so there haven't been too Many six month periods which have been In the red And once the Reds end it's very unlikely That we end up with another red we've Seen it happen once we had a Black Swan Like you know I'm not trying to factor In black swans into my own investing Because the probabilities of them are so Slim that I don't want to expect that I'm going to get a Black Swan every six
Month period or every year it just Doesn't happen so looking at this even With the Black Swan the next six month Period had a higher close it was green Because the close was higher than the Previous six months so that's the first Rule or the first thing you can do if we See a six-month period that goes below The low of the previous six month period While we're in a bull market and to Determine the bull market we've done That many times on the channel before And you can see that there's it's Unlikely that you'll get more than two Red six months in a row there was this Option here in 2014 and then the market Took off from that point so even with That third one lying on those dips Underneath the 300 mark was absolutely Fantastic buying pretty difficult at the Time because you can still see the Market drop 50 but that following six Months you're up and away so What I'm trying to say is we only have Two data points but that's why I've got The s p because we have a hundred years There if we see the next six months push Up a little higher and then close a bit Lower anytime that we get prices below The previous six month bath or if you Prefer candles that is go all in not Financial advice just look at the data From the charts but you can see that any Of those periods that the market went
Underneath that previous six months if We're actually given that opportunity It's a pretty decent buy opportunity I Want to show that in the s p as well Now you can see the previous bull market That was 2016 in 2017 there was no Six-month bar that went underneath the Previous six month bar until you hit the Bear market so there was no opportunity For that in that period of the market so Could we be in for one of those It is possible we see a six month that Doesn't go below we see another six Months and they're just grind out until We get to those Peaks for the final six Month bars of the bull market that's Option one option two have a couple of Ups and downs one little opportunity to Get in underneath that level and then The market takes off from that point now Let's drop it down to the three monthly Bar here So the three month might give another Couple of opportunities in the first Case there is zero opportunities this Yellow overlay is the Tia Gan swing Indicator so you can start to see where Those higher highs and higher lows are Or in this case a lower low this was in The accumulation Zone then the market Took off from that point so you've got a Quarterly candle and we're about to Close out another quarterly candle here Above the previous quarterly candle
We've got five days to go so the close At this one here was 28 500 if the Market can or if Bitcoin can drop below 28 500 then we'll have a lower close and This candle will go red nonetheless like You can see from the previous bear Markets in 2014 in 2018 and 2022 you had Multiple red quarters in a row or within That same period in this case three you Had two then a green then another red And then the most recent one we had four Quarters down that was all the bear Market but then from that point once we Got the turnaround there was basically No other opportunities to buy underneath Those lows and so that's what brings me Back to the title of the video Bitcoin Will never see these prices again rather Than me label the exact price you can See for yourself from the data on the Chart that once we get above the Previous candle so once the quarter Breaks the top of the previous candle Whatever the low is for that candle it's Probably unlikely that Bitcoin is going To see that price again within that bull Market the only time you've got is 2019 And again the Black Swan event I don't Want to keep having to go over that Because although that happened and some Of you have commented yourself It was extremely difficult for most People to buy it because of how extreme The fear was just for that
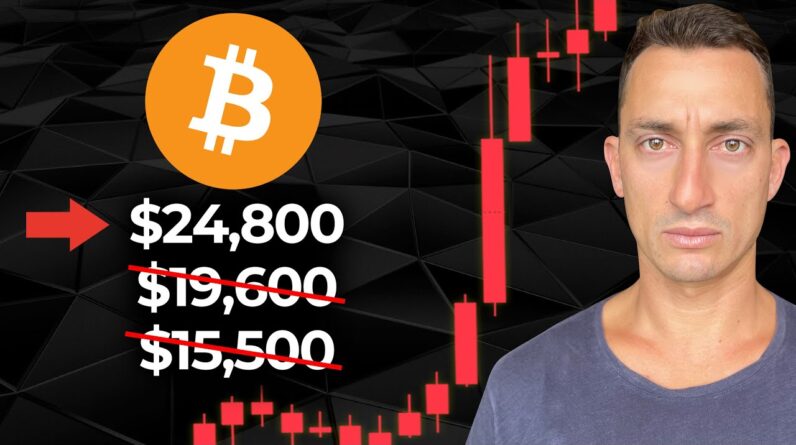
Few days a couple of weeks that one Month period depending on which Market We're in for uh for investors to get in Because of that extreme fear and then From that point the Market's taken off From there and so we're seeing that at The moment we've got two green quarters Up we had two green quarters up before Two red we had one that was just Underneath it so that was still a pretty Good buying opportunity underneath the July quarter so underneath that was 7 700 so any buying opportunities under That 7 700 you can see from hindsight With pretty good buying was great buying Actually for that next cycle same sort Of deal going back here if you're able To get in during this accumulation Period underneath that level I mean that Was the absolute bomb of the entire move You had that little test and then the Pump from there and there was no other Opportunities so it's really about Preparing for maybe there's not going to Be anything any more opportunities which Like I said leads to the title of this Video those prices for Bitcoin may never Be seen again and so we have the low of The previous six months and that was Sixty and a half thousand I think many Can say now that we won't see sixteen And a half thousand I do understand that A lot are still waiting for a 15 14 12 10 some crazy people are still waiting
For three out of their minds Not focused on anything that's actually Happening with the data in the charts That sort of analysis thrown out the Window that's noise get rid of it you're Going to be much better off without it So going up from this point here you can See if this is the Quarterly now if this is it if this is The price range that will stay in 31 400 and the low being 24 700 then It's possible that we'll never see under Twenty four thousand seven hundred again Just based on what we've seen in the Past except for this one opportunity Here so with that in mind if we did get It buying opportunity get in and wait Your turn wait your turn for those next Higher prices in BTC now let's get a Little bit closer to the action this is The monthly chart so looking at where we Are right now we are possibly going to Close at the highest monthly price for BTC in 2023 but we also have our Gantswing indicator on here so the Yellow indicator link to this is in the Video description you can find it right Underneath the free Tia Discord Community Link so from this point any Moves underneath those swings provided We've got bull market structure of Reasonably good buying opportunities the Reason is they don't happen very often The only time again was the covert
Pandemic was the c19 drop you got to Break under the monthly it was a higher Low from the cycle low than the month uh Than the cycle took off from that point Yet again and so in this case It's not completely out of the question But it's unlikely that we'll see a break Underneath the monthly swing bottoms We've covered the six monthly candle Close we've covered the quarterly Monthly candle close we've covered the Monthly candle close it doesn't Necessarily tell us what is going to Happen in July I'm going to do another Video on that so make sure you are Subscribed like the content up you know The deal down below but what this does Give us is a buying plan something Better absolutely better than trying to Predict whether the next month is going To be green or red I know most of you Are getting the picture you understand That this isn't about trying to predict What the next price is so that you can Go out and take your rent money out dump It into the market and then hope that Bitcoin goes from 30k to 60k this is About planning for the what ifs what if We do drop below what do the Probabilities tell us that's happened in History that give us the confidence to Make those trades that's exactly what We're looking at here I don't want to Try and predict prices because that's a
Nonsense game it doesn't matter what the Price is it matters what happens within That period getting to those particular Prices so we've covered all three of Those and I've talked about the title of The video as well some of these prices That will never be hit you've probably Heard me say multiple times before that 15 and a half K won't be broken and Previously very close to those that Timing of that low I was saying it's Probably unlikely 19 and a half will get Hit either bitcoin's probably not going To break that now you can see the Reasons why I think that's the case just Based on history these monthly swings Barely break in a bull market and I said It here in the video on April 13th the Interview here with Gareth so I think That anyone waiting for a break of 15K You can basically cross that off your List and you know sometimes I go as far As to say I don't think 19 and a half is Going to be broken just because of how Severe the news was on that low and then How big the reaction was from it that is Going back to those points of the market And the reasons why looking at where we Currently sit now I don't think this Current low is going to get broken Either I don't think 27 786 depending on Which exchange you're on is going to get Broken either for those reasons of Course we're a lot closer to that point
Now so you've got to weigh up that there Is the possibility but looking back it's Much easier to see now 15 and a half's Not going to get broken 19 and a half's Most likely not going to get broken sure If it happens it happens I always get Those comments down below you're wrong Just wait for this thing to collapse for Whatever bearish narrative reason we've Heard them all before I'm putting them All aside this is what I do day in day Out for over 15 years there's an Armchair analyst that wants to have a go At those prices what do I care I'm Playing the game how I see it okay so That's where we're at with those prices For BTC how does this look for the s p I've only looked at about 12 years of Data for Bitcoin quick look at the s p To cover the grounds here as well we're On a six monthly chart Going all the way back to the 20s we can Even go back into the early 1900s but Let's stick with around that hundred Years of data the main thing I want to Look at here is the six monthly swing And if the market breaks under that six Monthly swing what should you do well Obviously we still have some bears in The room that are saying the s p has to Collapse because of a looming recession Because of higher interest rates because Of you name it throw it in there Whatever the next narrative is throw it
In there but what we've seen in the past Is if it does break down while we're in The state of a bull market which is Where we currently sit then any Opportunities under those six monthly Swings is a great buying opportunity Check out the first half of 2020. we had The pandemic it took a pandemic to break A six monthly swing bottom it was only There for a matter of days before it Took off again excellent buying Opportunities you did not see another One of these buying opportunities uh we Had to go all the way back to the GFC Collapse where you had the six month Swing the market was under that for one Two periods and then bounced out of it So basically 12 months you had to Accumulate and then for the next 12 years you had no other opportunities 11 years 12 years no no other Opportunities granted it is a pretty big Range going from 1060 points to the low Here at 660. it's a big range but you've Got that time and when you look at Intern in context of a macro cycle it's Really not that much time 12 months over The span of 11 years is roughly 10 less than 10 of Time to accumulate underneath these Levels it's going to take big kahunas to Do so let's go back that's only Approximately 20 odd years so looking Back again going to the next six monthly
Swing break which we don't have on the Entire chart here even the 1980 87 Collapse this thing was massive it was All over the news all around the world It did not break a six monthly Swing Swing bottom and the market took off From that point even in the early 1980s Where we had the collapse again there Was another collapse in the market it Did not break a six monthly swing bottom We have to go back to the 70s for any Sort of period of a break underneath the Six monthly swing so you can see the six Monthly swing came down into this 1965. There was another monthly swing bottom Here in 1968 you can see it broke in 1966 buying opportunity you can see it Broke you had two six-month periods of Buying opportunities then you had the Big one in 1974 multiple before the Market took off and never to be seen Again that's it Market takes off from That point and it's gone of course There's money printing there's money Going in the system all the time that's What's pushing these prices up that's Often a rebuttal from from some of the Investors out there at the end of the Day what are you going to do complain Type about it in a comment section or Get your money into the market so it Stops getting chewed away from inflation The silent tax that's pretty much the The
The rebuttal to that excuse well there's Money printing so what well get into the Market if you can see these signals come Up get into the damn Market let's go Back again I said 100 years you can see This next six month period it was went Under there for a matter of a brief Moment in terms of a percentage Absolutely bugger all low to low 1.63 That was a break And the previous one here in 1957 to the Second half of 1957 you had eight Percent and then the only other times That happened were through and after the Second world war we're not there yet Hopefully we never get to another world War but that were they were the only Other times at the six monthly swing was Broken and it was barely even broken it Touched it and then took off touched it And took off so if you want to bet Against those odds by all means if you Think another one of these 1960s 1970s Eras is happening right now it's a Possibility but even so you can see that Anytime underneath that six monthly Swing bottom has been one of the most Incredible buying opportunities in History over 100 years that is for the s P so do what I do don't do what I do Keep the data keep the facts on your Side weigh the probabilities in your Favor so that you can make those calls When the time comes and when the time
Comes it is the most difficult to make Those decisions check out the times when It has broken the six monthly swing There's a six monthly swing right there That was your second half of 2008 which Was a Global Financial collapse the time That everyone remembers most people Weren't buying at that time very few Were and they were buying up big which Is what put stopping volume in and the Market took off same thing happened Three years ago the covert pandemic most People were selling Very few would belong now buying up big Look at how high that close was so I'm Not saying that we can never break that Swing bottom but when it happens I'm saying what I will be doing so we've Got a plan now for July let's take a Look at what happens at the end of the Month so we can close this out do Another update a few days time make sure You hit the like And subscribe button Let me know in the comments section down Below what you think is going to happen In this next stage of the cycle do you Think everything is going to rhyme like It has done in history or do you think This is still part of a bigger bear Market rally and a further collapse of The lows 19 and a half and 15 and a half If it is a bear Market it must break 15 And a half thousand dollars thanks again Guys I'll catch you at the next video
Big ones coming up the interview with Phil Anderson just waiting on that to Come through from the editors and then I'll get that out to you guys hope you Had a great weekend I'll see you at the Next one this has been Prices that Bitcoin will never hit again See the next one till then take care and Peace out