
🏆 (REGISTER NOW FOR OUR FREE TRADING WORKSHOPS) Plus Our Free Crypto & Economic Report Emailed To You:
🔥 TIA PREMIUM MEMBERSHIP: Trading Courses & Exclusive Community
Please subscribe and share the content with a friend if you find it valuable to you. Thanks, Jason.
UP TO $38,745 FREE! Crypto Exchanges
🥇 ByBit Free $30,030 + 0% Maker Fees:
🥈 Bitget Free $8,725 (US + Global Users NO-KYC)
🇦🇺 Swyftx, Best Australian Crypto Exchange, $20 Free BTC
(Disclaimer: Swyftx, ByBit and Bitget are channel sponsors. All decisions you make are your own.)
▶ My Official Socials ◀
YouTube
Instagram
Twitter
▶ My Must-Have Crypto Resources ◀
👾 Free TIA Community Discord:
📈 TIA Gann Swing Indicator
🏆 TIA PREMIUM MEMBERSHIP, Trading Courses & Exclusive Community
🐂 TRADINGVIEW ($15 Off)
🔐 LEDGER Crypto Wallet
👨🏫 KOINLY Crypto Tax (30% Off)
This video is for entertainment purposes only. It is not financial advice and is not an endorsement of any provider, product or service. All trading involves risk. Links above include affiliate commission or referrals. I’m part of an affiliate network and I receive compensation from partnering websites. #crypto #bitcoin #cryptonews
Bitcoin is down a whopping 4.7 this week And of course this has led many to think That we've got further to fall Forgetting that Bitcoin is now up 73 From the lows so it begs the question Have we been wrong in our Wyckoff Analysis have we been wrong in buying The lows around 16 to 18 000 have we Been wrong in saying that 19 and a half Thousand will not break on bitcoin let's Try and answer those questions today and Also look at some significant buy areas For BTC going forward in case this is Incorrect all right hit that like Subscribe let me know in the comments Sections where you are sharing the Content with a friend we've got tons to Get through today in our Wyckoff update Was I wrong in buying Bitcoin and we're Also going to get through the total Three market cap the altcoin market cap Looking at the Wyckoff schematic as it's Showing a very different picture to that Of Bitcoin now the last update we did Was about six weeks ago April 19th and If you haven't subscribed to the Newsletter what are you waiting for we Cover the stuff in great detail on a Two-weekly basis now the reason why I Bring this up the date is that we can Look back now six weeks ago this was Around the peak for Bitcoin but for the Stock markets they were just getting Started we've seen a bigger jump from
The NASDAQ and at that time many were Saying the NASDAQ had to form and he was Shorting the NASDAQ that was shorting Nvidia they were shorting Apple they Were shorting everything because they Thought that that was a peak in those Markets yet Those markets have now actually gone up A lot and in the case of Nvidia has Wiped out a ton of shorts bursting to New all-time highs why is this important For Bitcoin well we're getting an Understanding of where the overall Markets are at we need to see some risk Coming back into those markets Traders Investors wanting to jump back in with Their money and that is precisely what Has been happening with the stock market But for Bitcoin it's down approximately 10 from that high so we have seen a huge Move from BTC from November to the top Of a hundred percent now it's natural For the market to have a pullback we've Seen 16.6 and we currently sit at about 12 percent to the downside probably Today probably somewhere around 13 so It's nothing out of the ordinary to have A pullback but I can understand that Many think that this is the pullback That's going to take us to new lows Something that will break March Something that will potentially break The November low now I want to have a Look at that in terms of the Wyckoff
Schematic itself and look at Key areas For the particular phases that we're Probably in for the Wyckoff schematic And I'll look at a potential area that Maybe I was wrong in when it comes to The Wyckoff schematic so the first thing I want to go through is just a look back At some of the comments so I appreciate You guys dropping your comments because This really shows and it's not to cause Any hate whatsoever but I pay very Particular attention to what is being Said at particular times in the market Because we can look back on that and see For ourselves how the why the psychology Of the market is playing out we can see What the market sentiment is like it's Like a record of history at that time so Pay particular attention to it go back To the key areas go back to March 10th 11th 12th 13th when we had the banking Crisis low and you'll see a very Different picture from what people were Saying so this was at those Peaks there Looking at macro economic data can't Wait to see what he'll say about Bitcoin In the next video it's scary not to Analyze the macro economic data and just Consider them as narratives that's Precisely what they have done and Unfortunately for some people they they Sort of carry this forward too much in Their opinion and not look at the Technicals because from that exact date
From that March period the NASDAQ is now Up 12 percent Macroeconomics it doesn't matter when it Comes to the Chart if you've got your Technicals put those first then worry About the macro economics remember what We are trading here we are trading the Charts we're not trading the macro Economics of course we pay attention to Them but it's how people analyze them That analyze the macroeconomics that Gets them in trouble and Miss fantastic Opportunities this happens time and time Again and I've seen it for over 15 years Now it's the same thing time in time out Just like we looked at in yesterday's Video some of the macro economic Conditions throughout major lows in History So that's only one comment not to have a Go at Jeffrey Tong here I appreciate the Comments but it's really interesting to See what people were talking about Remember back then what the main thing That people were talking about was Genslow Gary genzo like no one talks About that anymore so to understand Where we sit it's really really Important the last bearish narrative I Heard was there's there's not enough Breadth in the s p move really clutching At straws and of course there isn't much Breath there still isn't and the market Has continued to go up and we're going
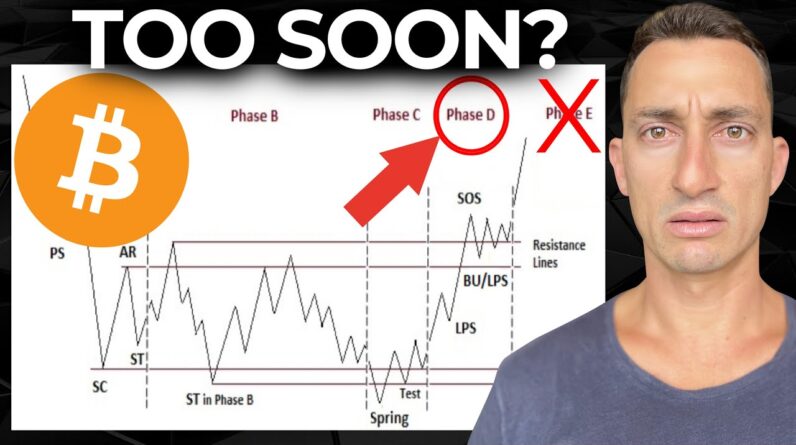
To look at the altcoin market as well Because many were still hoping and Holding on to their altcoins as they Were up from the December lows but Now we can see they've almost come all The way back at least halfway to that Point so I've gone on long enough about Understanding the market sentiment Looking at the market psychology of Course we're going to continue to cover This but I just wanted to give a quick Overview of that at the beginning of the Video because now we need to step into The game of the Wyckoff schematic so We're going to look at Phase D and phase A potential area that I was wrong in Let's have a look so this is the market Of BTC we've got our candles out we're On a weekly chart Let's bring up the Wyckoff schematic Here so first thing we note is a Potential phase D this is what I have Labeled as a potential phase D here as We broke out of the trading range here So looking at the upper range of the Trading range around that 25 000 level I Was considering that this could be the Phase e of the market so we've covered This as being phase a just like here We've covered phase b as being roughly This area here we've seen a secondary Test and then we've got the spring of Phase C so there's move to the downside That wipes out every last long everyone
Holding in and basically you see a lot Of selling come into play look at that Huge volume yet the market does not go Lower the next trading bar the next Trading period And so that is a really Telling sign that there isn't much Supply left in the market there's not That much coming on to the market and There is more demand now coming back in Of course the volume drops off from that Period because there's just not that Much Supply and from that point the Market starts to rise a little so we're Just understanding the volume in Comparison to what we've seen in the Past as well so still reasonably high Volume but we see it drop off compared To this particular big bar here now the Market tries to come down again yes some Volume comes into the market here as it Gets rejected at around eighteen Thousand dollars Volume drops off again because there's Not enough Supply in the market there is Not enough Bitcoin coming into the Market at extremely fearful times that Is what the volume profile is telling me This is something that we go through in Great detail in the investor accelerator That's Tia premium we have a specific a Wyckoff schematic course within the Hours and hours of content over here in Tia premium so we cover that in great Detail to learn how to read the market
At a short-term time frame and a macro Time frame as well and that's what gives Us the confidence to get into the market To buy when the market is starting to Break and I post about that in Discord As well underneath my million dollar Trading portfolio our crypto trading we Have altcoin portfolios as well and Exclusive posts And you can see all of that as to where I was buying here on the breakouts here At 18 and some of the other buys here Around that 17K level yes I was even Buying back here at 17K and some at 27 But I'm doing that on the basis of huge Move to the downside on really high Volume so there's other pieces to the Puzzle but for now we're just looking at The Wyckoff schematic here going into Phase d as this is the area that I was Looking at for phase D so LPS is Basically our last point of supply and Then the backup The Bu is the backup Like you can see in this area here Now the thing I have in question which I Think is uh wrong at this stage is the Phase D to phase e so I still see this As the low coming in most likely the Phase uh sorry it is the phase C and now This area here What I've got here is probably needs to Be moved over to this area but I'll let You in on another key point to note About the buying opportunities based on
Phase D because this gives us the Confirmation that we're starting to get That move to the upside And as Wyckoff has pointed out phase D If we are correct in our analysis if as We always note what should follow is the Consistent dominance of demand Oversupply This is evidence evidenced by a pattern Of advances it's what we've seen Signs of strength on widening price Spreads so let's look at that first and Increasing volume so widening price Spreads yes much wider than any of these Moves in the background and we had Another widening price spread And you can see it was increasing volume On the move to the upside increasing Volume on the move to the upside there Was even increasing volume here in that March week whether the banks collapsed Huge buyups and you can see the market Just closed really high back within the Upper trading range here so so far That's coming together quite well Widening price spreads increasing volume As well as a reaction as well as Reactions on last points of Supply on Smaller spreads and diminishing volume Smaller spread compared to the move to The upside here is the move to the Upside smaller spread smaller spread so Far so far okay and And diminishing volume diminishing
Volume Okay so we've got the move to the Upside nice high volume nice strong Volume to the upside diminishing moves To the downside diminishing volume to The downside what happened back at the Low you had diminishing volume as the Market was climbing because that's there That's showing that there is not enough Supply in the market and even here You're seeing that there is not enough Supply coming into the market so the Demand eventually the idea anyway is That demand is going to take over and Move this price out of this zone so Going back to the Y cost method here This is the key area now so if like it Says if we're correct in our analysis And I always put down that's an if of Course I have to have my bias and I stay With my bias until it's proved incorrect Because at the end of the day I'm Actually putting money into the markets And I'm not just sitting on the Sidelines like I uh talking head or an Analyst or someone that writes comments And doesn't actually invest in the Market so I actually have to put my Money into the market so I have to take A position whether that's the Market's Going to go down or the Market's going To go up and I have to know my time Frame so my short term or our long term And am I a Trader or investor am I just Buying for the move to the upside or am
I going to short the market as well am I A Trader so There's a lot of different things you Have to weigh up depending on who you Are and what you see next coming into The market During phase D this is this this is the Best part and why I had to back that up With or explain What type of investor or Trader you are Because this is the opportunity now the Price will move at least to the top of The trading range LPS's so last point of Supply in this Phase are generally excellent places to Initiate or add to profitable long Positions add to profitable on positions We've talked about buying through these Zones here Um I do not buy fifteen thousand five Hundred I didn't even buy in the 15 000 Range I bought in the 16 17s 18s 19s and The 20s yes I still bought through here But my positions are now profitable so I'm in a profitable position I bought it 19 900 posted to the group talked about It on Twitter as well because I saw this As a huge opportunity So like Wyckoff says here The LPS's in this phase are generally Excellent places to initiate or add to Profitable long positions so if this is A last point of supply Like the schematic shows here your
Backup and your last point of Supply Then these are the best places to be Adding to your position yes the market Can go down maybe it goes down seven Percent and touches these Highs at 25 000 maybe it comes back into this Zone Here and and tries to scoop up anything Above 22 000 so there's an 18 drop from The current price you know the current Price is a little low at 26 000 let's go Down to 26. maybe the drop down is only About 15 or 16 that's something you have To think about the price may never go Down 16 the price may only go down a few More percent maybe it doesn't even take Out the 25 800 again that's the stuff That we don't know but what we do know Is what risk are we able to take how Much downside can we understand if we Have that in mind we think okay this Isn't going to go down or it shouldn't Go down if our analysis correct it Shouldn't go down past the low here of Nineteen thousand five hundred can I Stomach a 28 drop because like we said Yesterday when we look to the upside There is potential to go very high There's the tops there's 142 percent There is the 48 000 top there's another 75 so then you'd start to look at your Risk to reward and I'm sure I'm starting To lose a few people here because this Is actually what trading and investing Is about is managing your risk the
Downside to your reward the upside so we Won't go on about that too much more People just want to know should I buy Now and the answer is in the pattern Itself and the answer is in what we've Just been looking at here And you have to regard How much downside there could be because Even if you buy now and it goes down how Much can you stomach to the downside Have that written down before you get Into positions so I think we've covered That pretty well phase d It doesn't look like we are out of that Phase D but in terms of the upper end of The trading range that is why I had this Sitting roughly over here because this Is possibly the trading range rather Than this level Up back here so that's what we're Looking at that's a possibility other Other than that if this is the D range And this is even a better opportunity to Be getting in here as well obviously Here with the the best opportunities but In case if this is Phase D and this ends Up being phase e over here what do we Look for next in Phase e the stock Leaves the trading range demand is in Full control and the markup is obvious To everyone so that's possibly why the Market up isn't obvious to everyone just Yet because we're still sort of trending Around in this phase D giving ourselves
Enough time to buy in to then move out To that upper side setbacks such as Shakeouts and more typical reactions are Usually short-lived new higher levels of Trading ranges compromising both Comprising both profit taking and Acquisition of additional shares so Re-accumulation by larger operators can Occur at any time in Phase e so if that Is in fact phase e This this Zone just here then this could Still be back at this level this is Phase e this is broken out Of the zone so that is actually phase D So this is where my analysis could Actually be right then this is the Re-accumulation area And this is still another opportunity to Be buying up as well as it mentions here In Phase e that's what's going on these Trading ranges are sometimes called Stepping Stones as we've often referred To them as on the way to even higher Targets so higher price targets keep That in mind if this is actually phase e These are going to be stepping stones They take time like you can see here you Know this has been November December so A couple of months another three months And what are we now March next week will Be basically three months in this zone So these stepping stones are potentially One to three or four months keep that in Mind as we continue up with this pattern
Of the Wyckoff schematic now over to the Altcoin market because this was very Prevalent in those comment sections many Worth saying that well I don't know About you but I like two to three extra Up from December lows even with the BTC Dominance yes there are plenty of Examples of the one-off coins but Overall I mean I can't analyze 20 000 Coins on here on one video you'd be here For weeks on end and my videos are Already long enough so when we just look At the Wyckoff schematic for the total Cryptocurrency market cap excluding Bitcoin and eighth then we get a very Different picture it doesn't look like We've broken out of anything here we're Still within this trading range between Phase a and phase B and maybe we have Another leg down to go and you can see From the December low these old coins Have not fared very well that's that Peak in April that everyone was excited About for altcoins a little bit of a Rally here from that march to April and Another significant Rally from December Into that February top but since then Market has come back a hell of a long Way and somewhere around the midpoint And we're just starting to break down From that level so there's probably more Downside to come for all coins overall If not in their US dollar pair in their BTC pair which means that profits are
Getting taken out of altcoins and thrown Into Bitcoin and eventually that could Lead to some slightly higher moves to The upside of BTC but for all coins it's Not looking that crash hot unless of Course unless you're a Trader and you Can see the short opportunities in the Market like plenty of our members here And I've got a link to this in the top Of the video description as well where You can sign up for the newsletter and Also get notified when our free trading Workshops come out once again these guys Are making fantastic profits using plans Sticking to their plans and getting Their returns in the market so well done To you guys that are getting your Returns as well and making money when The market is down so congratulations to You guys that's all I got for you today Make sure you like And subscribe let me Know where you're sharing the content With a friend and what do you think are We in Phase D or e or are we completely Wrong and this Market is going to take Out 19 and a half thousand dollars Thanks again guys I'll see you at the Next video have a fantastic weekend if I Don't catch you over the weekend until Next time peace out