🏅 (7 SPOTS REMAINING) Get Trading Now With Our Free Trading Strategy (3 Steps):
🏆 (COMING OUT TODAY) Free Crypto & Economic Report Emailed To You:
👾 (JOIN FOR FREE) Free TIA Community Discord:
📈 (BEST TRADING TOOL) TIA Gann Swing Indicator
🔥 (BECOME AN EXCLUSIVE MEMBER) TIA Premium! Trading Courses & Exclusive Community
▶ Subscribe to the channel for more macro market analysis on Bitcoin, Crypto, Stock Markets and Real Estate Cycles.
UP TO $48,755 FREE! Crypto Exchanges
🥇 ByBit Free $30,030 + 0% Maker Fees (NO-KYC)
🥈 Bitget Free $8,725 (US + Global Users NO-KYC)
🥉 OKX Bonuses $10,000 (US + Global Users No-KYC)
🇦🇺 Swyftx, Best Australian Crypto Exchange
Channel Sponsor: New Brighton Capital, Aussie SMSF specialists. Book your Free consult and use code “Pizzino” for $200 credit off:
▶ My Official Socials ◀
YouTube
Instagram
Twitter
▶ My Must-Have Crypto Resources ◀
Education – TIA PREMIUM MEMBERS, Trading Courses & Exclusive Community
Charting – TRADINGVIEW ($30 Off)
Storage – LEDGER
Tax – KOINLY (20% Off)
Trading – TIA GANN SWING INDICATOR
This video is for entertainment purposes only. It is not financial advice and is not an endorsement of any provider, product or service. All trading involves risk. Links above include affiliate commission or referrals. I’m part of an affiliate network and I receive compensation from partnering websites. #crypto #bitcoin #cryptonews
Surprisingly Bitcoin has held up Relatively well after a danger signal Yesterday as the market broke out of 25 000 on a false break and closed Underneath that level however Cryptocurrencies have been getting Destroyed and not in the USD format but In the Bitcoin pair stay tuned we'll Have a look at how that rotation is Affecting investors who are dollar cost Averaging into altcoins we're going to Look purely at the charts and history From the previous Bitcoin cycle to find Out how long altcoin investors may Continue getting wrecked increasing Their risk in the market rather than Just waiting for some key signals to Come up also got to update what's Happening with the traditional markets As we're finding some really solid Support critically above those log Downtrends with some volume coming into The market so we've got to jam pack one Today there's no time to waste like Subscribe subscribe hit that Bell Notification icon top of the video Description all those good links that You need for our free trading strategies And free crypto and economic reports Guys let's get stuck in with Forex Factory the announcements that are Coming up the stuff that everyone is Waiting for I'll give you my opinions on What I think is going to happen in the
Market leading up to some of these major Announcements so at the moment we don't Have too much left after the call CPI Data that was out yesterday there's some Employment data that is waiting to come Out as well for the Aussies and for the Americans as well it's everything is Waiting until next week Wednesday Thursday when we have the fomc meetings Everyone's holding on for that but I'm Here to tell you what the market is Actually doing right now and then give You my opinion in terms of the analysis Of what I think will happen leading up To that event and this is going to be Different to the vast majority of people You guys that have been following for Some time probably know that by now and So far it's been dead on point thank you Very much to the 18.6 year cycle that is Giving us the crystal ball to the Future So looking here at October 2022 so far That key significant low big day that Pushed from the low dead on that 50 Level pushed higher nice high close nice High volume you can see that in the Background here with the gray markets up Turned around big bearishness coming out Right here with the low we've been Covering this for some time and now We're sitting just slightly higher than That previous load In any case the market just needs to Hold up above this low here this is the
Key low that is pivoting everything Right now and like we looked at Yesterday Fair bit of volume has come Into the traditional markets and that Looks like we are forming another low Now this log downtrend going from the All-time high to one of the key pivot Points in the market on the way down Which was that August top now it's Anchored directly to those high prices Of the days it's not just a random line Drawn it's anchored key to those key Levels on those high prices as this line Falls to the downside that's our Logarithmic downtrend here you can see Just in the last 24 hours the last Trading session for the S P 500 closed Just above that level we've had a fair Bit of volume on the 13th of March that Was that fearful day after all the banks Collapsed on the weekend and then the Government came to the rescue of the Market We had pretty big volume on the Tuesday As the market ran up and then just in The last 24 hours again reasonably high Volume when you compare it to anything That has happened in the last couple of Months you'd have to go all the way back To that October low to get anything as Significant as this volume in the market And then we had a higher close so this Is all looking relatively good for a low To be forming what we don't want to see
Is obviously the breakdown of these Levels now with that increased volume You can see on each of these other lows There's been quite significant volume You can see in September there was very High volume a slight break and then a Quick bounce out of that low that could Be an option right now you can see back In June another load that we're looking At pretty significant volume when you Look at it compared to the entire Market Onwards and backwards from that point The market bounced out of that low as Well and then the next low wasn't that Much lower either The other piece to look at here is the Vix so it looks like we're putting in a Higher swing bottom on The Daily on the Vix which is the volatility index it Looks like we're putting in a lower Swing top which means we may see Volatility drop off again which Typically means that we're going to see The S P 500 increase again as you can See here this is basically called it Almost every single time make sure you Are tuned into the channel subscribe and I'll go through another full video on The vix and the s p bringing that up to Date looking at those highs and low Prices throughout history as well so on To the s p you can see here we are Potentially putting in a higher low just On the daily so a very small indicator
Here should we be able to break through These tops here at around 39.80 it's Going to be some good move to the upside Just in the short term so all these Little cogs have to come together this Is looking relatively good for the s p Leading into those news announcements Like we just saw next week there's about Five trading days left so I wouldn't be Surprised to see indecision right now as The market is waiting for some more news Events to come out however it looks like Some of the players are making their Move at the moment but of course until Some of these news decisions come out Typically we see some indecision in the Market across the board that is the same Thing that's happening for BTC at the Moment we had that big blow off top here Yesterday on Tuesday and then just in The last 24 hours we've had a slight Push to the upside to 25 289 and then a lower close we know the Lower closes aren't a good thing which Is why I put up that video yesterday Looking at this being a potential Warning you know flashing danger signals In this time really just so that we Don't get caught up trying to keep Buying tops and to be prepared in case There is some downside because it is Going to get extreme on the emotions and In the news again should we see some of That downside that's the reason for the
Warning because typically a lot of People don't check charts not saying you Guys but a lot of the time out there It's not a thing to look at a chart and Look at a price you get swept up on the Emotion of what's going on in the news In the media saying this is going to get Worse but when you zoom out again you've Got higher lows forming this so far is a Cycle low so if I zoom out any further You're basically starting to see some Higher lows forming now I've just put on A 50 level for the shorter term In terms of where we could see this drop Back to our next level is around 23 000 I reckon that's a good place as well Because it's in the middle of this Indecision right the bullish the cases To the upside the bearish case is to the Downside if we break these levels of 21 To 20 000 quite bearish because then the Next support level is basically that low There at 19 and a half so there's a fair Bit going on underneath these levels if The market is to break down however Right in the middle of this indecision Is 23 000 that is on this bar here so the 13th Of March you can see the volume really Did increase on Monday the 13th of March And it wouldn't be a surprise to see if The market needs to come back and test Somewhere in this price range to ensure That there is strength in those buyers
And this just wasn't all a big hype up Bubble of the market having to push up Higher based on the previous news events So it wouldn't be surprising if if we Did see a test in this price range of This bar based on the volume that we saw For that day and how fast and hard it Moved up from that point overall if You're not concerned with all of the Day-to-day stuff and the emotions of the News and the media and everyone telling Us that there's going to be another Collapse in the market then basically What happens in this zone for you is Almost irrelevant you're just waiting to See does the market find support at These lows at 19 20 21 and is it able to Hold that support to move higher again Or are we finding our consolidation at Higher prices which is a good thing Especially if we're consolidating at the Upper end of the 50 range so we're above The 50 here are we consolidating here in Order to push higher above that's all You're basically waiting for now in Between this could get very emotional as Typically happens in the market with the The Doomsday items of banks collapsing And what not coming out but in terms of The chart the objectiveness out there Leaving the emotions and the media Headlines aside then nothing really Matters until we break out of this one Way or the other breakout past 25 300 or
Break down past 20 300 or the low here At about nineteen and a half thousand Dollars typically with the strength in a Bitcoin move we start to see a push in All coins and then eventually these old Coins cannot hold their ground against Their Bitcoin value which is exactly What we're seeing right now in the Dominance and a pretty solid collapse in All coins but before we get to that a Quick word from our Channel sponsor New Brighton capital for Aussie viewers if You already control your own Super or Have already made the decision to set up An smsf New Brighton Capital Specializing crypto accounting for Self-managed super funds check out the Link in the description where you can Book in your free 20-minute consult and Be sure to use promo code Xeno for a 200 Credit off your smsf accounting fees Over to coinmarketcap have a look at the Bleed of old points now we're looking at The 24 hour because over the last hour Or so they've just started to rebound We're at zero percent or 0.5 but over The last 24 hours you can see a few of These are starting to hit single high Single digits some have even crossed the Mark and gone over to double digits here Like in the case of file coin at 17 uh Lido 17 these are on the verge of double Digits here uh H bar near vet you know You can basically go down this list here
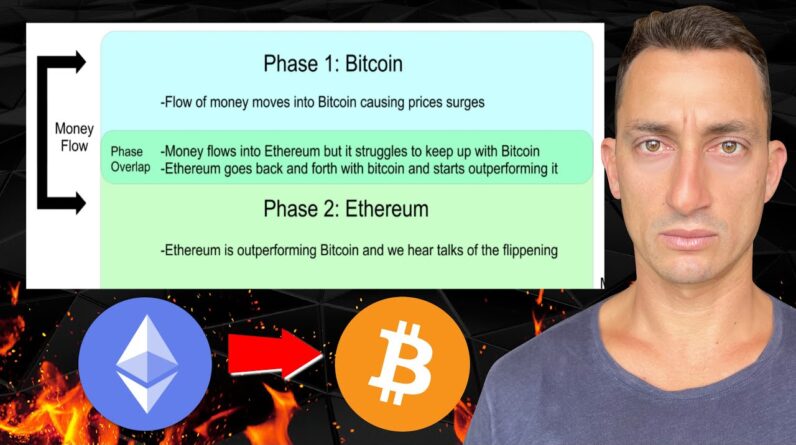
Phantom 13 down this is all against Their BTC value remember if bitcoin's Going up then their USD value will also Go up with it but at what rate at the Moment what looks like is happening is Our rotation now I'm not saying we're Going into an altcoin season at this Stage but it's an interesting metric to Have a look at here or a graph to have a Look at in terms of where the money Flows and we can back this up with Historical data over a macro scale here For all coins during Bitcoin Seasons From lows to highs and at this stage we Saw a lot of money flow into Bitcoin we Saw ethereum pump so some of the large Caps pump now we saw the old coins Everything else started to take off That's over the last week or so pretty Big moves to the upside then how it all Sells how it all comes out is you'll Start to see a sell-off of the olds Money potentially going back into Bitcoin or into stable coins and then we Start to see a bit of a sell-off from Bitcoin and stable coins maybe out into Fiat to protect some of those profits I Know we might be crypto Maxes here Whatever you might be but the fact of The matter is not everyone is and They're still going to be taking some Profits into fear so it typically goes Through a cycle like this basically a Rotation from the safer assets they may
Have peaked the money flows into the Altcoins for a bit more d-gening you Know higher risk which is why I always Talk about not to be investing in Old Coins until there are some key the Breakout levels this is the long-term Stuff different to trading I've got to Remind some people of that but then when We go to take profits sometimes you take Profits from all coins into Bitcoin and Stables I personally like to keep some In Bitcoin and in stables and take some Into Fiat as well so I can actually go And use some of those profits and that's What it looks like is uh happening right Now we see the Bitcoin dominance still Increasing 45 and a half percent and if I turn on our investor accelerator Bitcoin dominance which removes the Stable coins from the dominance chart Here you can see we are now at around 52 Which is the reading here on the the Right hand numbers so 52 and the market You can see here is at around 45 so this Has been an uptrend since May of 2021 Basically the first top area for Bitcoin And you can see the lows have have been Increasing during this time here so Bitcoin's really been on a solid run and These are some of the different times in The market that I've labeled here on the Chart we can see we've gone through a Market being more in sync here where It's gone from Bitcoin to alts and many
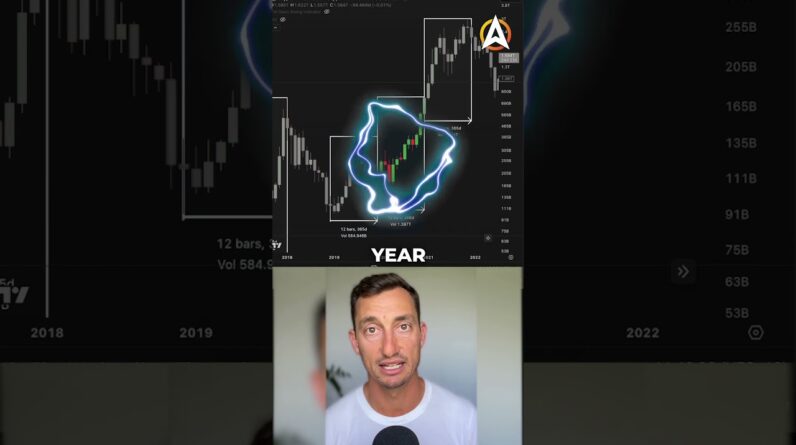
Times over to do those altcoin Seasons During the top of the bull market and Then during that bear Market of 2022 Which is basically this zone right here You can see that Bitcoin took charge Then all coins took charge and now Bitcoins on the charge again so if That's the case the long-term investing In all coins is not performing better Than Bitcoin that's just the data from The chart generally speaking there is Going to be the outliers out there as Well but generally speaking if Bitcoin Dominance is on the rise all coins are Not performing as well as Bitcoin on a Whole when you zoom out probably to a Weekly or a monthly chart now this is Potentially the bottom uh here For Bitcoin so that's the dominance Where the dominant sits right now when Bitcoin price bottomed and you can see From that point we started to head up a Little faster than what we have done in The past now taking a look back at Previous Cycles as I've labeled them all Here the bottom from 2018. there's November and we had to run up this is The Bitcoin dominance going up which Means all coins were bleeding out then All coins took over a little bit and it Was basically a somewhat balanced Market From low to low however from that point In April when Bitcoin basically broke Out to go to close to 14 000 that was a
Huge charge for Bitcoin dominance which Means there was a bleed out of all coins Primarily eth around those periods Because ether's the second largest Crypto which means the dominance has to Come from somewhere but overall that was Where the dominance is coming from and Going to from all coins into Bitcoin Bitcoin Finds Its Peak goes sideways and Down because this is September now and Then eventually we had some micro alt Pumps and D5 summer which led in 2020 so There is a fair period here where Bitcoin does take a lot of the gains Away from all coins so it's something to Pay attention to if you're looking to DCA into altcoins for the longer term Pay attention to the Bitcoin dominance Chart so that hopefully your investment Is doing better over the long run than Bitcoin because otherwise what's the Point of taking a higher risk if you Could just throw it into Bitcoin and Stay safe here's a quick look at some of Those altcoins which are starting to Bleed and ethereum looks like it has Finally broken that thin ice we're not There just yet you can see still see There are a few loads here at around six And a half percent to 6.7 percent but it Is definitely on that down move here Against its BTC value on a longer term Time frame we saw that with FTM against Bit the Bitcoin pair just in the last 24
Hours pretty solid move to the downside 11.3 11.5 percent file coin I'll go Through some of the majors in a sec but Here we go 15.9 that's the file coin Losing value to BTC yes it is up from The lows in December or November but how Long do you intend on holding these old Coins that's the key question here if It's a short term you're making way Better money than Bitcoin if it's longer Term that's yet to be seen for example One of the favorites of the noob Investor Link Link BTC has been crushed Over the last few days going from about 3 000 or probably thirty thousand Satoshi's down to 26 000 satoshi's in terms of a percentage Move to the downside that's about a 14 Loss against Bitcoin let alone what it May be against the USD value and at the Moment it's coming back down to the Previous lows in May of 2022 and June 2022 so the next stop is probably Somewhere around here in the likes of Link think some of the other popular Cryptos in the top 10 and 20 Matic also On a down move here as it put in a lower Top on the macro scale you can go to Solana BTC which hasn't had a great move Overall after getting absolutely Hammered from the top this is also down In the last 24 hours about six percent With a lower low here in December from November so I'll be on the lookout for
Any sort of hopeful support coming in Here if not this could continue down as You can see this is a pretty long move To the downside against their BTC values Theta is breaking previous lows in January so it's breaking down again this As you can see is a typical pattern of An altcoin against its Bitcoin value and This is what I've been warning about Throughout the entire bull market when It comes to all coins if you find Yourself in this position it sounds kind Of Doom and Gloom Come next bull market try not to hold on To these old coins throughout the entire Season majority of these things are just Not going to make it and if you want to Keep some profits get the hell out of All coins at those periods right now They are bleeding out against Bitcoin And I'd be watching the lows do they Break those current those previous lows That's a sell signal if they don't you Do what you need to do with those old Coins but Whatever you got to do put it in your Plans to get out of all old coins Whenever there is a good pump and come Next season none of these are going to Make it to the moon that's the way I Play the game I've been through two Cycles now these old coins just don't do It they're hopes and dreams I hope you Can live out your dreams stay safe in
The markets don't get screwed on these Old coins they are a load of But what isn't is the profits That they can get you in a very short Period of time when there is a mega Altcoin season remember to take profits And like And subscribe to the channel Links in the top of the video Description of the videos popping up Here for your educational purposes I'll See you guys in the next one until then Peace out