🏆 Free Crypto & Economic Report Emailed To You!
📈 TIA Gann Swing Indicator
🔐 Crypto Storage LEDGER
Has my macro outlook for Bitcoin and Crypto changed? No.
But I am anticipating a significant pullback will eventually happen. History proves this.
In today’s video, let’s discuss how much bitcoin could drop by, when it might happen, and what might the price be?
▶ Subscribe to the channel for more macro market analysis on Bitcoin, Crypto, Stock Markets and Real Estate Cycles.
Subscribe to Michael’s Channel
UP TO $48,755 FREE! Crypto Exchanges
🥇 ByBit Free $30,030 + 0% Maker Fees (NO-KYC)
🥈 Bitget Free $8,725 (US + Global Users NO-KYC)
🥉 OKX Bonuses $10,000 (US + Global Users No-KYC)
🇦🇺 Swyftx, Best Australian Crypto Exchange
▶ My Official Socials ◀
YouTube
Instagram
Twitter
▶ My Must-Have Crypto Resources ◀
Education – TIA PREMIUM MEMBERS, Trading Courses & Exclusive Community
Charting – TRADINGVIEW ($30 Off)
Storage – LEDGER
Tax – KOINLY (20% Off)
Trading – TIA GANN SWING INDICATOR
This video is for entertainment purposes only. It is not financial advice and is not an endorsement of any provider, product or service. All trading involves risk. Links above include affiliate commission or referrals. I’m part of an affiliate network and I receive compensation from partnering websites. #crypto #bitcoin #cryptonews
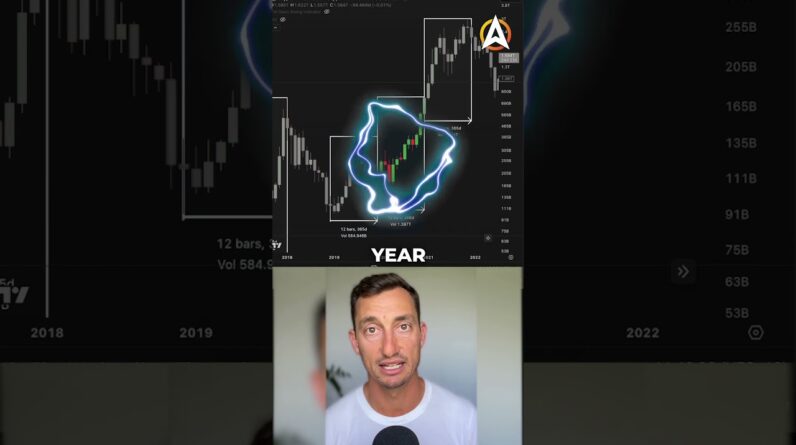
While there's a lot of uncertainty Around the direction of the economy Whether we're going to fall into a Recession what's happening with Bitcoin Cryptos stocks and real estate the Charts are showing us a different story This time we have the macro swing Indicator on our two-week chart turning Green in this video let's look at the Objective data around what happens next After the swing chart turns green from The bottoms of Bitcoin let's get started With our index finger by clicking the Like button at the top of the video and Subscribe to the channel I'm trying to Make that like section exciting for you Guys and of course the top of the video Description link is our free crypto and Economic report go to our website and Hit that free report once every two Weeks to your email inbox along with our Channel sponsors buy bitvit get and for The Aussies Swift X Australian Cryptocurrency exchange down there for Your massive sign up bonuses all right So we're looking at the trend reversal That has happened on the two-week chart Here for Bitcoin using yeah TI again Swing indicator this is the yellow line That you see here that is marking in the Tops and the bottoms for the weekly Chart and in terms of the data itself We're using two bars so we're looking For two moves in the direction of the
Trend so two weeks down or two weeks up Will turn the trend of the chart it'll Turn the swings and once we break out of The swings this gives us the trend Changing so we've just seen that happen At the beginning of January and this Current week also broke to another Higher so this is setting in new highs And new lows on the macro chart here on The two week swing you can see we're on A weekly chart and we have two week Swing now I want to go back to the Previous cycles and have a look at how This has occurred we're going from the Red to the green essentially we've been In Bear markets before we go down for a Year or so and then once this Market Turns green like you can see here this Generally marks the end like we've only Got a few Cycles to look through here The market has not gone below the Previous cycle low so let's first take a Look at 2017 top the 2018 bear with that Sideways accumulation period quite a big Range through 2019 and 20. so the market Obviously headed down from that point The trend turned red that's what this Background is right here and the yellow Swing tops allow us to see that the Trend is still down the macro Trend was Still down it wasn't until the breaking Here of April in April of that top that We got the green background here the
Reds and the blacks it's all down or Uncertain but essentially this is all Down from this point the market turned Green and obviously we went on a nice Big run to the peak of June like you can See this did take some time if we Measure from the low to the next low This was 455 days the low to the top 196 days the low to the next top around 427 days and then the cycle low to the Next top was 616 days and I want to take It to the breakout point of that Previous top so as it broke 14 000 roughly 700 days so we still have a Fair bit of time at these levels even Though the trend is now showing us that It's turned up we've got a green Background here as it's broken through The weekly swing top and the trend can Turn red again but the important thing Here is that we're looking for a cycle Low signs of a cyclope probability Swinging in favor that the cycle low is In and with this green background with The trend turning green this gives us Another pretty good sign that the low is In now the other time that the market Went from Green to Red then back to Green was through the pandemic we had a Very severe drop to this low it was Short-lived and before you know it You're back into the green so buying any Sort of pandemic low we should see the Market continue to stay green
Potentially black at in an uncertain Time but still the cycle low looking Like it is formed based on the trend of This indicator turning green stepping Back to 2014 and 15 we have the bear Market that's coming to plug in you can See how clearly the trend is showing up With the Tia Gan swing indicator you can See those tops you can see where you can Put your short stop losses at the point There and then exit that short position All the way from the top down to the Lows based on Gan swings as the market Broke out of the top the trend turned Green And then we went sideways for a little Bit a little bit of a volatility move And then of course the market started to Rally from that point you can see that Again there was one short period of a Red Trend because that's showing that The highs were becoming lower and the Lows would be also becoming lower but Another important factor to note here is That the lows continue to remain above The cycle low so we had that first sign Of green the first Trend breaking the Bear Market Trend within this period Here then that was a sign that we were Off to the Races from that point the Ganswing indicator is linked in the top Of the video description it has Developers working on it all the time so If there's anything that needs updating
We are there to update it this is not a Stationary tool that someone's developed And it's just died off this is something That is live and working all the time It's something that I use for all of my Trading as you can see here how it Identifies the trend from the top to the Bottom and clear signals on the way down That the market has not yet reversed all The way until these bottom areas where You start to get a change in the Background here of the trend color so Looking at this in terms of time frames As well through these bear markets you Can see we had the bear Market of 2015 And 14 that lasted around 400 Days that Took us all the way to the bottom then We began to go sideways before the trend Turned green so it's important to note The amount of time that the market had Spent trending down before this Market Turned green the reason I bring that up Is that we can fast forward to the top In 2021 the trend turned red but then we Went up again because the tops were Taken out the market was trending up Again but it wasn't very long until them But in terms of time we hadn't spent Very long to the downside we had 70 days From the top to the bottom and then as It broke out was only 175 days so Basically six months from the previous All-time high to the breakout whereas we Know from previous Cycles we had 400
Days in the first bear market and around 360 days in the second bear Market going From the top here to the low so this Needs more time when we're looking at it From a cycle top to a cycle low just Like what we've seen now so looking at It from the current top to the current Low the timing now is 378 days so Verging on that 400 day period before we Got the green signal to turn now you Note that we also have another green Trend here where the trend has turned up After the market started to fall and has Turned red so looking at this in terms Of a time frame again from the top to The bottom same sort of thing around 77 Days we know that this period was 70 Days from the top to the bottom now We're seeing 77 days and so this is not Long enough for the market to establish A cycle low before the market turns Green so we can identify false moves Based on time frames the time frame here Was that it was not long enough for a Cycle low to form we've seen in the past It generally takes about 360 days to 420 Days to develop a cycle low so this here Was a false break turning the trend Green then we had the collapse from that Point and of course the rest of the bear Market continued now that we've passed That time frame past that 360 to 400 Days from the low we've turned green Once again and in the past two cycles
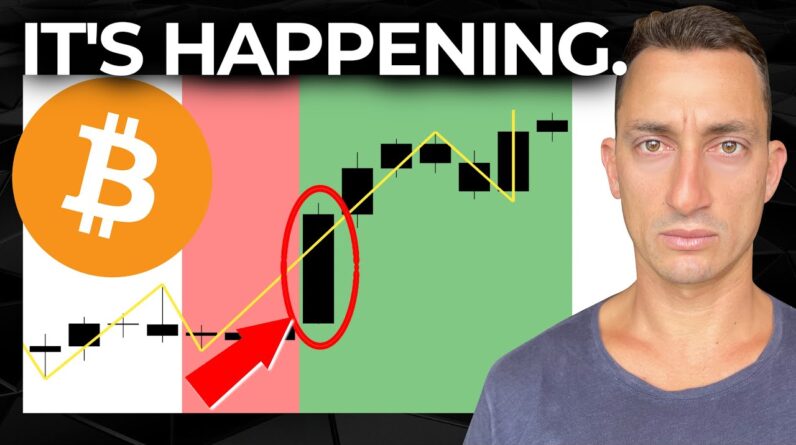
This has led to the start of the bull Market of course plenty of volatility at The beginning that has to be expected Big moves to the upside big moves to the Downside like we covered in yesterday's Video so pay attention to that I'll Leave a link to those videos at the end Of this video overall what this signal Has showed us in the past is that it is The beginning of a bull market even Though there can be extreme volatility Like we looked at for yesterday Possibilities of tops coming in and 4 Moles of 30 to 60 percent from wherever This particular rally peeks out that is The price ranges that we could expect to The downside the beauty with this Indicator is that it is one simple Indicator that is used across all time Frames the minutes the hours the dailies Weeklies annuals whatever it is that You're trading this indicator helps Identify those tops the bottoms and the Areas you could be placing stops for Profit taking or entering positions this Is the indicator that we use for all of Our trading and it's something that all Of our members use here at Tia premium So check out the link in the video Description if you want to learn more Become a Trader in cryptocurrencies or The stock markets because it is one Indicator that works across all charts The game swing indicator also takes all
The guesswork out of which way is the Market trending we're always trying to Figure out where the Market's going up Or down as you can see with the Background colors this gives you that Signal of UPS or downs and of course Also adding in layers of indicators and Filters across Justice this one tool Allows us to get closer to the market For those extra profits and reducing the Losses I got more videos coming up on How you can use this indicator for your Crypto trading looking specifically at These swing tops so make sure you've Liked subscribe Bell notification icon And if you are trading the markets check Out the links for buy bit and bitget for Our International users and no kyc's Over there and up to thirty eight Thousand dollars of sign up bonuses Across these two exchanges we also have Free trading workshops coming up but You'll have to use those links to get Invited to the free trading workshops Thanks once again guys I hope you've Found tons of value from the content I'll see you at the next one check out The links that are popping up on your Left hand side over here until the next One peace out