🏆 Free Crypto & Economic Report Out Now!
📈 TIA Gann Swing Indicator
🔐 Crypto Storage LEDGER
Subscribe to Michael’s Channel
The time has come for the SP500 and Bitcoin. Recession fears are peaking, GDP continues to rise and Bitcoin rockets to Greed on the crypto fear and greed index. Something needs to give. Let’s discuss what these indicators mean and what I am anticipating the market to do next in today’s video.
Timestamps
00:00 Intro
01:14 OTT appreciation for you
02:00 Alpha
10:00 More Alpha
▶ Subscribe to the channel for more macro market analysis.
UP TO $48,755 FREE! Crypto Exchanges
🥇 ByBit Free $30,030 + 0% Maker Fees (NO-KYC)
🥈 Bitget Free $8,725 (US + Global Users NO-KYC)
🥉 OKX Bonuses $10,000 (US + Global Users No-KYC)
🇦🇺 Swyftx, Best Australian Crypto Exchange
▶ My Official Socials ◀
YouTube
Instagram
Twitter
▶ My Must-Have Crypto Resources ◀
Education – TIA PREMIUM MEMBERS, Trading Courses & Exclusive Community
Charting – TRADINGVIEW ($30 Off)
Storage – LEDGER
Tax – KOINLY (20% Off)
Trading – TIA GANN SWING INDICATOR
This video is for entertainment purposes only. It is not financial advice and is not an endorsement of any provider, product or service. All trading involves risk. Links above include affiliate commission or referrals. I’m part of an affiliate network and I receive compensation from partnering websites. #crypto #bitcoin #cryptonews
Today marks the first day that the S P 500 has closed above the bear Market Downtrend this is not calling the end of The bear Market however it is still part Of the bottoming process something that We've been looking at here on the Channel for 2022 and into the first half Of 2023 this came about from the lows in June and our final look at the lows in October where we anticipated October Being that low the cycle low for the Bear market now it's not over yet and I Could definitely definitely be wrong Which is why we're going to continue to Cover and look at both sides of the Market however we will take a bias to One side based on what the information Is telling us because at the end of the Day if you are to be investing in the Markets buying or selling you need to Take one side of the market based on What you were seeing of course you don't Have to take my word for it but I am Going to present to you what I see in The market and how I'm playing the Markets and that's why you're here Liking the content subscribing Bell Notification icon pushing the content Out there to more people which is Precisely what we've been seeing on These recent videos so thank you guys Very very much and if this bear Market Is in fact coming to an end I'm going to Be very very sad because the comments
Within the bear markets and these times As the market is turning around trying To find out what it wants to do are Absolutely incredible I don't just mean That to give you some sort of Sugar-coated comment it is so much more Rewarding seeing you guys in this bear Market and this process of coming out of The bear Market than at the all-time Highs when there are just people here Trying to make money the quickest way Possible and then get absolutely Destroyed so hats off to you guys I know Is a big intro but it really does mean a Lot I really enjoy seeing your comments And your growth in these comment Sections down below all right enough of That fun stuff at the beginning let's Have a look at what's going on this week In the markets and the big one here Where we're seeing the markets begin to Peak in that market sentiment and roll Over and then how we're finding it Objectively in the charts as well one of The big pieces of news this week looking At Forex Factory is the GDP so this came Out above anticipation so this is the Forecast here 2.6 the gross domestic Product of the US is actually increasing You can see this particular chart here It is going up and it has been going up Since the pandemic low there is yet to Be a quarter of negative GDP growth Based on how the US is recording that
Data now and I know there are a lot of Differing opinions out there as to when We should be in a recession or not or You know why it should be a recession Nonetheless this is what the data is Saying this is what the percentages have Come back at so the actual was higher Than the forecast which is a good thing For the currency or the economy itself And we'll look at the currency as well As it's been something we've been Covering for quite some time with that Peak in September so GDP is out what's Next for some of these major Announcements coming up over the the Coming week or so where we have the high Impact stuff the red here core pce price Index also looking at that but the major One I want to have a look at here is a Little further down which is a federal Funds rate and so the previous forecast In actual we're at 4.5 percent as the Previous the forecast is 4.75 and next Week around the first of February for The US guys that is my birthday so Reminder to wish me a happy birthday on That day and for us here will be February 2nd that's going to be the date That we find out about the interest Rates and the market is anticipating Just a 0.25 interest rate rise something That we've been looking at as well Looking at how these interest rates have Begun to slow but it doesn't mean that
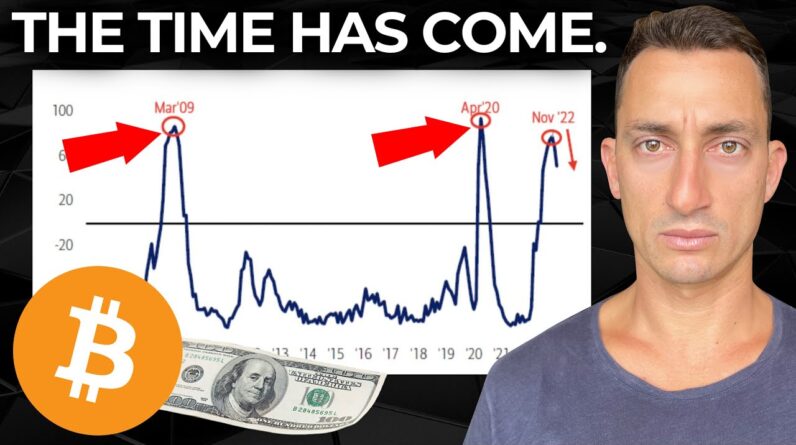
They will stop but it looks like we are Slowing and potentially stopping for a Period of time so that's the big one to Have a look at at next week and it looks Like the market is anticipating the Actuals you know what it's actually Going to be said as they've been lining Up pretty well over the last seven or so Months so moving on to the big Market Sentiment piece and we have a big Bitcoin piece to look at as well in Terms of Market sentiment and where this Is starting to roll over in a potential Pullback for BTC In terms of every session net percentage Saying recession likely in next 12 Months has begun to roll over and this Happened in April of 2020 the bottom was In March of 2020 so that reached its Peak of global fund managers saying that They were expecting a recession this was A rather quick one like we can see from The GDP here this was the only recession There was just for a quarter And it also happened in March of 2009 People expecting a recession likely in The next 12 months which was actually The bottom of the s p so the bottom of The stock markets so moving my head out Of the way just for a moment so we can See the dates here the 2020 uh peak of Federal Global fund managers saying that It was the peak was about a month after That low could this be the case again
November of 2022 was the peak of this Recession likely in next 12 months by The survey here so potentially a month After the load just like what happened In 2020 however in 2009 that came at the Exact low remember the low that we're Looking at for the s p was in October so That came in on a round it was the 13th Of October and then the peak was in November basically the peak of the Market calling for a recession and we've Looked at this covered it many many Times with how significant this Particular Peak was or the the calls for Recession over 2022 and potentially into 2023 however this is what we've been Anticipating because we'd have to Anticipate in order to make decisions in The market and put our money into the Market we can be wrong but we have to Take a position in order to trade so We've been anticipating this low coming In and the market rolling over and Eventually becoming weaker in their Calls for recession and almost to the Point of flipping from their calls in Recession now we've had to do this Earlier in order to get as close as we Can to the bottom we're not always going To get it right but hopefully more often Than not we do so that we can make Better calls for our portfolios so That's the the big one at this point in Time the likelihood of a recession is
Coming down From the Bank of America Global fund Manager survey which is basically called Those bottoms pretty well on point over The last 14 years these times in the Market are quite difficult the bottoms Are always going to be difficult and the Tops are always going to be difficult Which is why we look at a multitude of Factors most importantly the charts to Give us a reading of what people are Actually doing with their money at that Point in time it's no point going to the News because the news is just giving us A report of what's already happened but We need to try and forecast what's Coming next doesn't mean that we will be Right 100 of the time but more often Than not we're trying to be right and at Least have stops in place ideas of where We would should get out if we are wrong So far nothing is suggesting that we are Going to be wrong and the market is Going to fall past those lows it will Fall but not looking at the market Falling past those lows 3 500 on the s p And 15 a half thousand on bitcoin these Are the type of comments you can expect Around lows and potentially tops too This is what a lot of people are Thinking at that time and it's really Important to understand this especially In context with Market sentiment Something like you cannot compare
Anything to anything right now markets Are completely disconnected and Manipulated if you find yourself going Into a rabbit hole of calling markets Manipulated and you can't compare Anything meaning you can't look at History and every time is different get Out of the market now save yourself Heartache and money everything is Manipulated but everything is charted Everything shows up on the chart where People are buying and selling so that You can make your decision around where The manipulation is occurring and which Side of the market you want to be on do You want to be going long or do you want To be going short based on all the Manipulation that is going on in the Market so if you find yourself always Calling markets manipulated and things Being disconnected stay out of the Markets do yourself a favor and save Yourself some money it's always Manipulated no matter where we are all Right so that leads us on to the next Piece here some more interesting info Here around the panic and Euphoria model Which is basically reaching it its Extremes right now so I don't weigh Everything on this but it's interesting To note where these pieces of data come Up looking at the low here this panic And Euphoria underneath the green dotted Line here is the extreme pessimism and
We're basically going through that at The moment it's basically marked a lot Of these bottoms you can see the red Dots here and at every bottom almost Every bottom you get extreme pessimism And then at the Peaks excessive optimism It usually flows into a longer period at Those tops rather than sharp peaks in Tops and the reason for that is people's Emotions we can get very very fearful All together one foul sharp swoop to a Low but at Peaks we like to remain Greedy for a longer period of time and It's much more difficult to see which is Why the tops form slightly differently So that's just a quick look at this Panic Euphoria model because I think It's very interesting to see more Market Sentiment here now moving on to the US Dollar and the weakness that has Continued here goes beyond my Expectation I did expect to see at least More of a bounce here but the swing Chart keeps us safe in this case there's A link to this in the top of the video Description you can find that right up Here and again swing indicator and I do Talk about it a lot because it because It is part of my trading plan this is The main thing I look at to assess the Trend and to know where I could place my Stops in case I'm wrong and how to get Into the market so that I can actually Enter a position again in case I'm wrong
But if I think the market is going to Keep falling yet the market starts to Break some swing tops so in this case The US dollar and why we're using this Is just to assess how strong maybe Crypto Bitcoin will be over the coming Weeks now the US dollar we uh called for A top here in September and that's Precisely what has happened based a lot On the market structure and the extreme Sentiment at that point in time for the US dollar to continue up and everything Else to collapse so far the opposite has Been true US dollar has collapsed now The final bit of support here is around This 101 102 and it's holding out here For the last few weeks we have only seen Sort of one week bounces at any time During this particular collapse the main Thing is we still are above those those Highs and the 50 levels so maybe we do Start to see that one to four week Rally Or at least more than a one-week rally Here which could cause Bitcoin to start To roll over and of course Cryptocurrencies to follow on that now I'll have a video coming up about real Estate and s p and the macro economy so Make sure you are subscribed like the Content all that sort of stuff because We are starting to see a rollover in a Fixed mortgage rates as well in the US So there's a lot going on now with house Prices not collapsing as people are
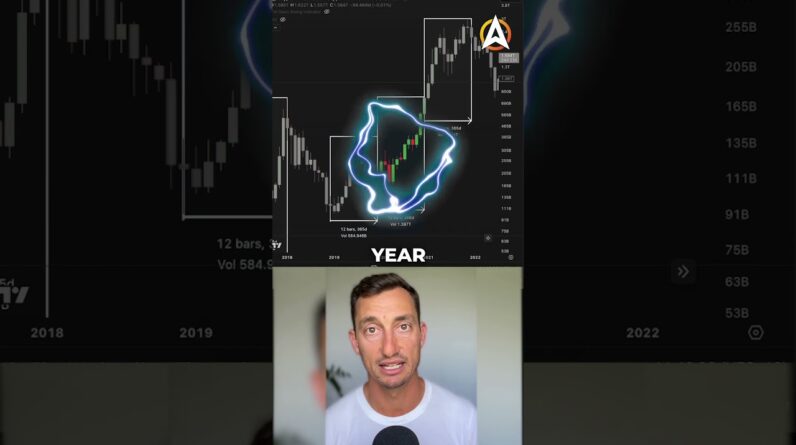
Anticipating especially retail and then 10 what tends to happen is a flurry to The market after this so I'm going to Follow that up in a future video but Just letting you guys know so if you are Interested in the macro economy and how Things are all playing out subscribe Like all that sort of stuff you know the Drill to see this content in your news Feed and that leads me to the potential Rollover like we looked at with the US Dollar and now for BTC this level where We are now finding ourselves in the Crypto fear and greed is at 55. this Comes out at greed could you believe Just a month ago that we would be Finding ourselves at greed on the crypto Fear and greed index absolutely wild now I'm just going to draw a line in here so We can see where 55 actually lines up With this period through here 2018 2019 Is the runner to that 2019 Peak where Bitcoin went from about 4K it broke out In April of 2019 went to that peak in June of 2019 to around fourteen thousand Dollars You can also see we had a bit of a Correction here uh at that that greed Point just before the market collapsed Into that pandemic low so the market was Starting to climb out of the December 2019 low this was for Bitcoin and then It rolled over again we've had multiple Times where it's come up to about this
Particular level here just into that Greed before the market had a reversal So you can see it again here in July we Had it again right through this period I Need to draw that up so it's about April May of 2022 basically going into that Peak before the market rolled over into May and uh again just early to that so That January February basically it was The bear Market rally early on in the Bitcoin bear market so around this 55 Level Is where Bitcoin and crypto potentially Roll over just maybe even for a short Period of time if that is the case of Course that's going to bring a bit of Fear to the market in Bitcoin and like We've pointed out in those earlier Videos from this year earlier in January Where I was looking at my forecasts for The s p and for Bitcoin we could Potentially see ourselves roll over into Mid late February maybe into early March To find a low now I'm not saying that This low has to be a lower low than that Previous low but I am anticipating a low At some point in quarter one which we Have been covering for quite some time On the channel here now is this the top I don't know I'm not trying to claim That it's a top but maybe we go a little Higher maybe we break out of the 25 000 Area and then start to roll over into Some sort of low I don't know what that
Price is going to be the main thing I Look at is the timing and eventually the Timing ends and we start to roll over Into the next frame of timing as well so I'm keeping my eye out for that and Should that area only come down into the The 20s or the High Teens I'm going to Be taking those opportunities and I'm Telling you that now because a lot of People did not buy through this area Even though I talked about it for a long Time and through this area here so I'm Not trying to tell you to buy but just Keep your eyes alert keep your awareness Out there for any sort of good buying Opportunities especially if that news Gets extremely fearful because it looks Like not trying to claim that it's the End but it looks like we are flowing Towards the end of a bear market and any Sort of opportunities to these lows Especially if they are higher lows and We get that macro confirmation when the Next levels are broken out are going to Be very good buying opportunities if you Wanted to play it safe you would wait For that low to come in and then wait Again for The highs to be broken that is the Safest entry point something that I've Covered a lot when it comes to all coins And how I will be playing all coins for Those macro long trades because this now If we get this higher load this is going
To be probably one of the most pivotal Points in all of crypto and Bitcoin for This upcoming cycle the higher low is Going to be the strong point here now is That the higher low or was this the high Low we'll see but of course this is my Call for this being the absolute key Point coming up in quarter one the Higher low is going to be very very Important and just for a little bit of Support and resistance levels for those Pricings in that time frame we can just Pull this Square across into a rectangle And you can see why I've drawn it two Around that area there the lows are at Around 18K and those upper levels that Are about 22k so if you're waiting for The lower end I'm not saying it's going To happen or if you're waiting for the Upper end maybe that's as high or as low I should say that we ever come back to So stay aware stay tuned to the Channel Watch the price of eggs as they continue To soar and potentially take out Elon Musk as the world's richest man and I'll See you guys at the next video like Subscribe you know all the good stuff Down below stick around for the videos Popping up on your left hand side and I'll catch you then peace out