🏅 Get Trading Now With Our Free Trading Strategy (4 Steps):
🏆 Free Crypto & Economic Report Emailed To You:
👾 Free TIA Community Discord:
📈 TIA Gann Swing Indicator
🔥 TIA Premium! Trading Courses & Exclusive Community
▶ Subscribe to the channel for more macro market analysis on Bitcoin, Crypto, Stock Markets and Real Estate Cycles.
UP TO $38,755 FREE! Crypto Exchanges
🥇 ByBit Free $30,030 + 0% Maker Fees (NO-KYC)
🥈 Bitget Free $8,725 (US + Global Users NO-KYC)
🇦🇺 Swyftx, Best Australian Crypto Exchange
▶ My Official Socials ◀
YouTube
Instagram
Twitter
▶ My Must-Have Crypto Resources ◀
Education – TIA PREMIUM MEMBERS, Trading Courses & Exclusive Community
Charting – TRADINGVIEW ($30 Off)
Storage – LEDGER
Tax – KOINLY (20% Off)
Trading – TIA GANN SWING INDICATOR
Channel Sponsor: New Brighton Capital, Aussie SMSF specialists. Book your Free consult and use code “Pizzino” for $200 credit off:
This video is for entertainment purposes only. It is not financial advice and is not an endorsement of any provider, product or service. All trading involves risk. Links above include affiliate commission or referrals. I’m part of an affiliate network and I receive compensation from partnering websites. #crypto #bitcoin #cryptonews
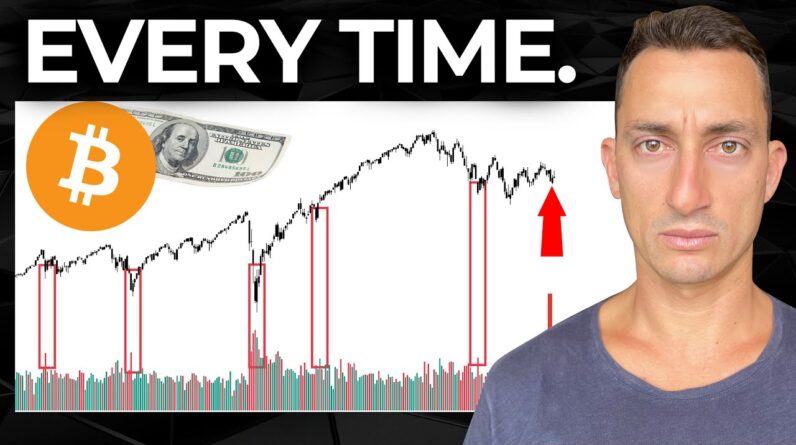
The markets are following in the exact Same footsteps as they have done in Every previous cycle the stock markets Bitcoin you name it it is following the Exact same process today we've just seen The fomc meeting with the FED raising The interest rate by a quarter of a Percent to 25 basis points now hitting a Target rate of 5 however has this Changed the Outlook of the market that's What we want to dive into in today's Video so you know what to do hit that Like And subscribe to the channel as This is your home of macro cycle Analysis all the way from the stock Market cryptos and of course real estate The biggest Market to pay attention to In the world all right let's start with The most recent news announcements the Old funny mentals as Ed say Coda like to Call them five percent is what we're Currently at now we're up a quarter of a Percent you can see that we're starting To ease on how high these interest rates Uh that the hikes are coming out so this Leads many to wonder when do we start to Pause and start to come down interest Rates because of course this is the most Feared thing amongst retail and macro Analysts out there they believe that When the interest rate increases the Market has to collapse then they believe Also at the same time that when the Interest rate goes down the market also
Collapses it's called the the old pivot But we have seen many times before in History that this is entirely untrue I Point you in the direction of this great Chart that my brother's done up on his Channel Michael posino there you can see That interest rates have increased in The past and remain flat and dropped yet The market continues to go up the main Reason for this is that while we are in A macro bull market using the 18.6 year Economic and real estate cycle the Markets will continue to go up Regardless of what the interest rates do Has been proven over history one thing To note typically at the beginning of The interest rate Rises the market will Go up the land markets will go up at the Beginning eventually they get a little Too high and this is what a lot of People are worried about right now However we're just coming back to normal Interest rates so looking at this in the Past interest rates had started to Increase this is the second half of the Real estate cycle which was the last Stage of the massive real estate boom Back in 2003 through to 2006. Interest rates were increasing property Prices were going ballistic many of us Weren't around back then and may not Remember I was in the market things were Ballistic Australia UK US Canada you Name it things were going absolutely
Mental around the world in this time and Interest rates were Rising this was the End so things change after the end of The cycle but also during the.com boom Which we've pointed out before here late 90s properties started to take off again Interest rates started to rise and Properties also increase at that time Again you can see here in 2016 interest Rates were Rising property prices were Also Rising as well and now we find Ourselves in the predicament where Interest rates have risen and the prices Have fallen on the stock market and Flatlined through real estate so pay Particular attention to this if and when The market or the FED starts to pause on Interest rates or even cut interest Rates it doesn't necessarily mean we're Going to get a collapse in the market But we're not far off it there's Probably a few years to go there will be A big collapse but it's not time just Yet what we're going to look at today is How this Market is unfolding and how the How we're following the exact same Footsteps of every single cycle previous To this Is what's happened in the last 24 hours We have dropped off 1.6 on the S P Getting rejected here at our short term 50 level at 4024. now there's a really Good quote and point here from Alex if You're not following him on Twitter I
Suggest you do it's one of the few People who understand the macro analysis Side of the market from a fundamental Point of view one of the very very few On Twitter that is not spouting the same Old nonsense about the world collapsing Now there is a a good point here this Will be one of those special fomc the Meetings that's what we're talking about Here where we may see a strong Trend and Sue from the meeting itself from pal Only to reverse in the full in the day After if that were to happen get ready For blood that could be blood from the Bears to visualize how this would look Let's check the chart so this is what we Are looking at here so we've seen a Strong Trend it doesn't necessarily have To be a strong trend to the upside but We've seen a strong trend from the Meeting note that we're still above the Banking collapse low we're still above The December low and we're still above The current cycle low of October as well And September which had very high volume So we're still above many major lows and 50 levels so what we've seen is a strong Trend going uh back to what Alex has Talked about here but then get ready to See the full reverse the following day This is just a very short-term Outlook If it doesn't happen no stress just keep An eye on the macro lows that have Formed in the market so far so if we
Take a look back at what happened in May There was a strong Trend in this case to The upside on that day so this is a Green bar right here on the fourth only To be followed by a reversal strong Reversal the other way this was the Meeting back in May of 2022 and we're Due for another meeting in May as we've Just had the one here in late March you Know they're six weeks apart So there's your strong trend from the Meeting only to be reversed the Following day what do we see in the last 24 hours we see a strong Trend right now We'll wait and see whether we do get That strong reversal the next day of Course the Bulls are hoping for this and The Bears are obviously hoping for Further downside nonetheless we're still In a transitional period period which Has been going on since the uh the May And June lows of 2022 we have not Changed the trading range here from a 3 500 point to 4200 Point trading range The Midway somewhere around the 38 to 3 900 points we're currently sitting at 39 To 4 000 points so we'll keep an eye on This over the next few days and continue To watch the significant lows which are In October of 3 500 points and show us Being up from that low of 12.7 as a Reference point for our other major Stock markets being the NASDAQ which has Had its own turn of significant news
Events being the svb collapse the bank Collapsing NASDAQ is up 21.4 from the cycle low a Bear Market begins when the market drops 20 from its top which we've seen a bull Market starts or a bear market ends and A bull market begins once a market is up 20 from the low just technically Speaking something to keep in mind with Where the current position of the market Is just pulling the data from these Particular charts which are also putting In higher lows and also bouncing off Their log downtrends so how does this Market repeat the footsteps of every Single Market prior you may have heard Me talk about this a few times before The volume is an important metric to Watch we're seeing the lows here on the 13th of March with high volume come into The market and again on the 17th of March more high volume here compared to The previous couple of months which Didn't have as high of volume once we Start to see a lot of volume form at These lows this is a footprint in a Hallmark of significant lows being Formed in the market which then start to Put in higher lows and the market climb Out of them now what happens at those Lows in terms of the news and the market Sentiment is that it is very bearish so We have the objective view here the Information from the chart the data here
Looking at the the bars the volume Everything that is a fact that is Getting pulled directly from the chart So you can see a lot of volume coming in In the march of 2020 low so exactly Three years ago we had a very Significant low with the covert pandemic A lot of volume and the market pushed Away Now if you've forgotten what happened at Those times we had very significant Pullbacks these periods were extremely Fearful because the market was still Quite fearful however we continued to Put in higher lows so I'm using our Tia Gan swing indicator a link to this is in The top of the video description along With instructions on how you can use it For your trading and investing the main Thing to note here are the higher lows That continue to form on the market Every time there was a very significant Pullback these pullbacks are occurring On bad news such as what the market is Looking at today today the market has Pulled back but the important piece to Look at is where do these higher lows Come in or where do the lows come in and Are they forming at a higher Point September 2020 higher low formed here And the same narratives being pushed Over and over again for this period if You remember the old supply chain issue It hasn't gone away okay it just doesn't
Get talked about as much anymore in Terms of a news narrative so these were A lot of those issues back then multiple Lockdowns new strands of the pandemic Covert thing and then supply chain Issues as well so it's essentially just The news continuing to repeat the same Thing until it doesn't have an effect on The market anymore and as you can see From the swing lows they're continuing To get higher and higher and higher Until we get a turn and then the market Heads down which is why this tool is so Effective this indicator here the Gan Swing indicator is so effective in Helping position yourself in the market So we go back to some other areas where Markets found some lows you can see the Low here in 2018 the market was climbing Out of this low a scare occurred and We've started to put in further lows we Put in higher and higher lows as the Market continued to climb out of that Point this is the same footprint that Happens every single time in the market A significant and low forming here in Early 2018 significant volume came into The market we have another low in late 2018 significant volume coming in at This particular low now you may have Seen on the channel where I've covered This on bitcoin where we have Significant volume coming in at very Significant lows if you haven't make
Sure you do subscribe and like the Content up as this is very very helpful For your own analysis to not get too Swayed in the the noise that comes out From the news and the media out there Again we can go back to 2016 very Significant lows at very high volume Again a significant low and a push out Of this low before the market took off With very high volume this was around The election time this was when Trump Was voted in and the market skyrocketed After that point there was the initial Scare high volume and the market took Off the opposite direction very Significant volume in 2010 you can see Here it's the highest volume that it had Since the GFC low the market stopped Which is essentially what's called Stopping volume we had a few attempts to Try and take out that low but it Continued to bounce higher and Eventually put in a higher low and the Market ran away from that point again we Start to get increased volume around the Lows it's essentially called stopping Volume it's the buyers coming in Stepping in to take control of the Supply because they believe the price Should be marked up higher this is a Prime time to be entering the market When you see these lows getting higher On a macro sense and the volume Increasing at these points now this is
Why it's a game for the experienced Traders and investors note that here in 2010 the volume the extreme volume that Came in on this particular bar was early On in that accumulation stage so for the Average Trader or investor mostly Investors it's going to be difficult for Them to hold on for the ride between May 2010 and and when the market actually Breaks out and gives you a profit in September 2010 we're looking at a five Month period of an accumulation Zone With multiple attempts at taking out the Low but the lows got higher and Eventually the market sentiment turns And the Bulls take control yet again now What if this doesn't work I think it's Always important to have a look at the Opposite side of the equation I know That I may have a bias to the bull Side Based on what I'm seeing on the charts Using the data there but what if this is One of those occasions which The market continues to fall well the Main thing here is this swing indicator This is why we continue to keep the Swing indicator on the chart here we're Looking at a weekly chart with a two bar Swing overlay you can see we had some Very significant volume at this low Before the market ran up into its final Peak so note that this is a different Timing aspect in the market this is the End of the cycle where what we look at
Now is we're potentially at the Beginning two different things here but What if the indicator fails and breaks Down what if the market continues to Fall after significant volume at that Low well then we refer back to the Indicator did the swings break down and In this case they broke down came back To retest the underside and then fell Away note the differences here this is Early on in the bear Market the collapse Of the GFC we are now 15 months from the Top in January of 2022. this is quite Early on so things are beginning to Change and the timing in the cycle is Quite quite different but it is really Important to know what if the market was To break down then We'd fall back on the indicators and the Rules based on this indicator so where Does that leave Bitcoin after the fomc Meeting well we are still holding well And truly above the previous breakout Zones of twenty five thousand dollars Now if we do start to fall back and Continue to to test some lower prices we Still have a lot of support beneath us Exactly what we looked at in yesterday's Video so recapping that the support Levels are 25 300 that was the previous Top in February before February before The market broke out and also the tops Back in August so we do have some Support uh coming up to the downside
Which was previous resistance we have Broken out in pretty significant volume So let's see whether we do get that Opportunity to be buying the dip at a at A price than 27.3 also to the downside We have previous levels here at 23 900 Which is around the 50 level at twenty Four thousand two hundred so there's a Good area there at around 24 another Level at 25. and any in any case this is Likely to give us a better buying Opportunity however I'm not going to get Stuck on the sidelines thinking that we Have to get down that far after such an Incredible run so far these are just a Particular areas that bulls will be Looking out for to hold support and hold Market structure in case we got an Invalidation and the market did start to Break down from these levels after that You have 22 000 but basically closing Underneath this zone is not going to be Great for Bitcoin Bulls and the Bears Get to take a little more control if we Do close back under this Zone that is Going to be the key for the Bears if There is further pressure to the Downside for BTC at the moment so where Does this leave the total cryptocurrency Market caps what's going on with crypto Right now well this same footstep print That I was looking at for the S P 500 Looking at volume and swings applies to Anything with a chart we have the same
Thing happening for the total Cryptocurrency market cap all the Cryptos out there We're looking at a level of 1.18 trillion for the total Cryptocurrency market cap to overcome we Are doing a pretty good job here of Holding those levels and pushing higher Having a short-term pullback at this Stage but as you can see the the lows Are beginning to form here and we're Starting to break through some of the Previous uh tops that were set in the Market at around one trillion dollars so This takes time this is a monthly chart It is going to take time to play out but If we do start to get closers back above The highs here at 1.18 trillion that is Going to be setting up the Bulls for a Longer term move now taking a look back At the previous cycle we can see this Took several months for the market to Boom from about a hundred a billion here At these these lows here 90 90 billion Up to those Peaks there at around 400 Billion that can take many months and Then another several months of Re-distribution and finding its feed Again before the accumulation took place For that next major altcoin season so Although we still have time on our side We may be at the beginnings of another Move up once we start to consolidate Where we currently sit
And I know how much people had it the if Only if we get back above the monthly Swing tops and the resistance levels of 1.18 trillion now I've got a lot further To go in with this data but I'm going to Leave it for a future video to try and Keep them under 20 minutes so stick Around like And subscribe this next Video that I'll cut that'll come up in The next few days is going to look at The total cryptocurrency market caps and Find out how long these periods actually Take before we can start to see some Bigger pumps in those markets I've also Got a Wyckoff video to get through for You guys so don't go anywhere like Subscribe you know what to do links in The top of the video description for our Free crypto and economic reports live in Bitcat still have their massive bonuses Going on plus there's also 300 of free Usdt on those exchanges using these Links down below that has eight days Left so if you want to get on board with That click those links down below and Follow the prompts there guys I'll see You at the next video I hope you have a Fantastic day until then peace out


