🏆 Free Crypto & Economic Report Emailed To You:
👾 Free TIA Community Discord:
📈 TIA Gann Swing Indicator
🔥 TIA Premium! Trading Courses & Exclusive Community
▶ Subscribe to the channel for more macro market analysis on Bitcoin, Crypto, Stock Markets and Real Estate Cycles.
UP TO $38,755 FREE! Crypto Exchanges
🥇 ByBit Free $30,030 + 0% Maker Fees (NO-KYC)
🥈 Bitget Free $8,725 (US + Global Users NO-KYC)
🇦🇺 Swyftx, Best Australian Crypto Exchange, $20 Free BTC
▶ My Official Socials ◀
YouTube
Instagram
Twitter
▶ My Must-Have Crypto Resources ◀
Education – TIA PREMIUM MEMBERS, Trading Courses & Exclusive Community
Charting – TRADINGVIEW ($30 Off)
Storage – LEDGER
Tax – KOINLY (20% Off)
Trading – TIA GANN SWING INDICATOR
Channel Sponsor: New Brighton Capital, Aussie SMSF specialists. Book your Free consult and use code “Pizzino” for $200 credit off:
This video is for entertainment purposes only. It is not financial advice and is not an endorsement of any provider, product or service. All trading involves risk. Links above include affiliate commission or referrals. I’m part of an affiliate network and I receive compensation from partnering websites. #crypto #bitcoin #cryptonews
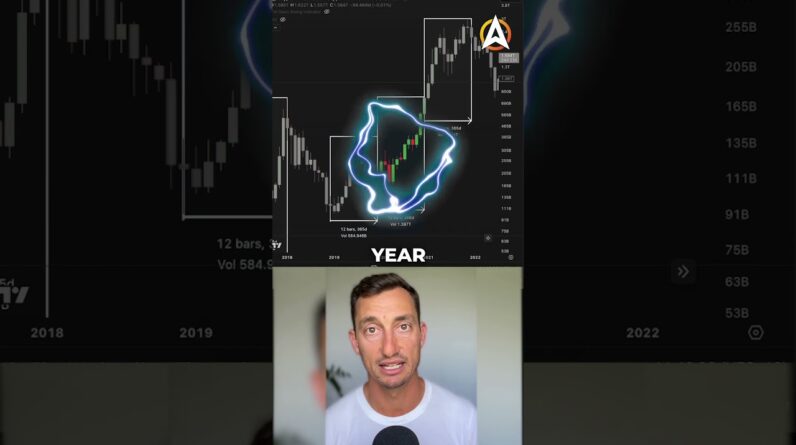
Data shows there is trillions of dollars Sitting on the sidelines waiting for the Perfect opportunity to enter the market Whether it's stocks cryptocurrency or Even real estate history has shown that When this data Peaks when the most Amount of money is sitting on the Sidelines this is typically at the major Cycle lows so is now any different are We at the major cycle low with over five Trillion dollars getting ready to enter The markets let's have a look at the Data in today's video like subscribe Don't notification icon and to finish Off the shells in 20 seconds our free Crypto and economic report is coming out This week less than 24 hours to go so Make sure you do subscribe to that and Only three days to go to the end of the Month for buy bit and bitgets 300 Giveaway just use those links down below And follow the prompts there this is Part of our Tia free community with our Investor accelerated newsletters this is What you can expect they're full of data Going through crypto Bitcoin real estate Markets all coins and of course the D5 Space within all coins as well so this Is going to be a big one coming up this Week make sure you do subscribe all Right so let's have a look at the money That has entered the market and money That is also on the sidelines waiting to Enter the market here is a quick nice
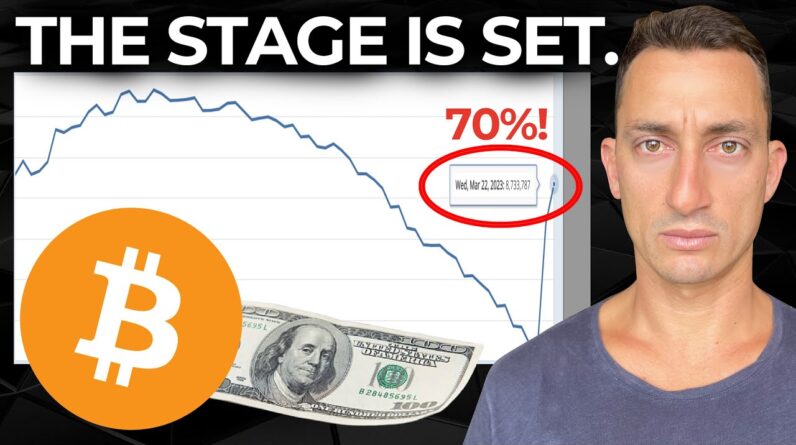
Graph around basically another 90 Billion entering the market from the FED We're up now about 70 percent of the Entire quantitative tightening so we're At close to around this uh nine million Marks basically nine trillion there Dropping down to 8.3 and now with the Money injected from the banking crisis We're back to around 8.7 here so the Info here is about 70 of the money has Come back into the market since we Tightened last year which you would Expect or at least start to quantify That if that 70 has come back in where Would that leave the NASDAQ and other Stock markets if that money was to flow Back into the stock market from or in The areas from where it came from so 70 Up from the NASDAQ low puts the NASDAQ Back at around 14 900 points and so far We see the NASDAQ sitting at 12 800 so Still about 2 000 points to go Now many are still waiting and hoping For a major collapse to the downside Obviously after the banks fell a couple Of weeks ago or at least a few of the Banks but I'll just put this to you as Well when it comes to news headlines and Basically anything that's around the Fundamental headlines and the media's Narrative about what's going on in the Markets this is statistically irrelevant These headlines are statistically Irrelevant because the news is there to
Tell us about the one in one hundred Thousand story that happened doesn't Tell us about the 99 999 other times that it didn't happen For example a plane crashing there might Be one in a million or one in 10 million Now tell us about that but they don't Tell us about every other plane that Landed safely that day so that's why we Don't put the emphasis on those dramatic News headlines and the emphasis goes on The chart here and so if this is a case With 70 of the money coming back into The market after quantitative tightening Meaning that they've printed money again Which is essentially quantitative of Easing then maybe we could consider that This Market will eventually come back And hit this 70 percent sooner rather Than later which gives us another 16 Right to run on the NASDAQ and we know That the stock markets when they're Looking healthy also crypto is looking Healthy but in this case it looks like Bitcoin is running first as we've seen It break out of significant tops first As for the NASDAQ it's still sitting Above the logarithmic downtrend it is Putting in higher lows from the cycle Low of October regardless of what the Headlines and the narrative is telling Us if you needed to see it for yourself These tiny red candles just here If I zoom in these one two and there's a
Green one here that is your banking Crisis this tiny little area right here That is the banking crisis and from that Point we are now above the previous Resistance levels and it seems like We're putting in a consolidation above These resistance levels now sitting at Around 12 800. the next Target levels to break out Of which uh looking like they could be Resistance would be 13 600 and then as We continue to climb this Market here Somewhere around that 14 900 15 000 Psychological level and we could also Look back to some of those previous lows And there's a top here and another top Sitting around that fourteen three so There's a lot of work to do to get up to The tops which is exactly why the Narrative continues to be bearish Because it hasn't broken through the All-time high yet that's typically when The narrative will change from the Bearishness to the bullishness we'll Still hear a lot of bears out there but The Bulls well the bullish narrative Will start to become more prominent in Those headlines but for now this is what People do want to see which is why the Media keeps giving it to us the bearish Headlines moving on to where the rest of This money is and this data we have Household Bank deposits and money market Funds sitting somewhere around the high
Trillions it has excess cash Holdings We're at 2.6 trillion at the end of December so quarter four in 2022. now I've got another one here that shows the Money market funds asset at 5.1 trillion now if we take an average In between or add the XX cash to the Bank deposits and money market funds Here this sets you somewhere up in the Low 4 trillions this data here shows Around the low 5 trillions either way It's a ton of money I don't think Anyone is going to disagree with that We've got trillions of dollars sitting On the sidelines now just taking a brief Look at this you've got 2009 this was The bottom of March of 2009 exactly 14 Years ago was the bottom of the stock Market cycle then we had the covered Pandemic crash here in 2020 another peak In the market so these Peaks are money Sitting on the sidelines this typically Happens at the tops of the market so if This is to happen again maybe more money Comes into the market over the next Couple of months who knows from this Point but we're really starting to push The limits of how much Market our money Is sitting on the sidelines and Eventually this money starts to flow Back into the markets which causes the Start of those bull markets to really Flourish we can see that here from the Peak of
2020 so 2020 at those lows there this is The money leaving the the funds coming Back into the market here so you can see That moved down into 2021 was a pretty Big move on the stock market that's this Move through here 2020 into the peak There of 2022 so basically the end of 2021 a pretty decent move here is 2009 And then again the money leaving the Markets there that goes up into 2011 Here are the peaks in 2012. And looking at that money market here You can say 2009 into 2012 and then uh Eventually it just flat lines and the Money starts to come out of the market Again so that shows that at the Beginning of these moves that's where The most percentage is made at those at Those lows from the market as it pushes Up that's typically what happens you've Got the big percentage moves from the Bottom quick move out and then Eventually it starts to roll over at the Top there people are looking to take Their profits so if you miss out on These areas now at the bottom this could Eventually sort of move all the way up To 5000 points and then you'd only just Start to see this thing trickle over You've missed out on a pretty decent Move from 3 500 points to five thousand You know you're sitting somewhere around Quick maths what 50 60 70 something like That from these low points to that next
Level and then the retail will start to Think to get into the markets after that Point does this money flow into Bitcoin In how is it stacking up on the Technicals for Bitcoin at the moment Let's have a look at that but first a Quick word from our Channel sponsor New Brighton capital for Aussie viewers if You already control your own Super or Have already made the decision to set up An smsf New Brighton Capital Specializing crypto accounting for Self-managed super funds check out the Link in the description where you can Book in your free 20-minute consult and Be sure to use promo code Xeno for a 200 Credit off your smsf accounting fees so How is this five trillion dollars going To work its way back into Bitcoin Eventually some of it will work its way Back here we're not expecting trillions To come back into Market because there Are the on-ramps are just getting Tightened in the US we've got this whole Operation choke point going on from the US trying to stop the on-ramps into Cryptocurrency That could be a tinfoil hat moment I Don't know the main thing that it seems Like that's going on in the U.S is that They're trying to slow the possibility Of more money entering the market However the market in the case of Bitcoin is showing us something
Different there are still ways to enter The market there are plenty of on-ramps Out there if it's not coinbase or Binance there's still plenty of ways to Get into the market and we're seeing That in the price of Bitcoin we've gone From 19 and a half thousand eighteen Days ago to now 27 100 sure overnight it Dropped three percent but look at where The support is we've broken through the 25 000 level we have support back at Twenty four thousand basically 23.9 so If we get a nice healthy pullback and Then the move start to increase again so Jump from those low levels we're Probably looking at another move to Higher prices to test that 28 to 29 000 Level so regardless of the news Narratives that are going on at the Moment especially with the finance uh Lawsuit from the US it seems like it's a Nothing burger and I'll stand by that Especially when we see these major news Pieces come out svb collapse silvergate Collapse and the market bounces from That point this is something that I Posted on Twitter if you're not Following obviously go check out the Links in the video description but I Posted this and it was laughed at saying You have to wait there's going to be More fallouts it's going to be bad for Crypto we're going to go down further The technicals we're just not saying
That and it's hard to imagine that Technicals can override the fundamental News headlines but really when you give It some time you really start to see why The technicals will override those Fundamental headlines they're basically There like we said at the beginning of The video to put fear into the newcomers To put fear into the market to try and Scoop up lower prices and we talked About this on the video yesterday the Wyckoff video here so if you haven't Seen that I'll leave a link to it at the End of this great video fantastic Positive feedback from you guys so Thanks very much for that as well so Going back to this I've got this chart Here which we will revisit time and time Again just have a look at where these Major Catastrophic collapse event Announcements come out and just how you Can see the price of Bitcoin compared to When those actual uh situations arise This is the FTX collapse we are well and Truly above that entire area of the Collapse and we're above the Silver Gate Collapse we're about above the svb Collapse U.S equities August Peak this Is when S P 500 peaked as well the Market came down there was a lot of Inflation fears at that time and Basically we're sitting now in the price Range of the interest rate hiked fears
Back in June and this is also around the Time that Celsius Voyager block fight Those sort of things went down we're Getting close probably not any time in The next few days of to break these Levels at those low 30 thousands but at This rate we'll probably get there and Break back above above these fearful News events which is typically what Happens at the beginning of bull markets Which is essentially called climbing the Wall of warri something we've talked About many many times in the past so Looking at the grand scheme of things The macro picture this is what happens During the bull markets in the short Term you definitely see the price go Down while that news is out for the day So it becomes good trading opportunities For those short-term Traders but then You've got to differentiate are you a Short-term Trader or a long-term Trader We're looking at the macros here this is What is showing up time and time again As is a few of the other macro Indicators which are quite common out There so I think it's important just to At least recognize those indicators the First being the 200 week moving average We've seen that already this has been Two weeks now it's closed above the 200 Week moving average which is the blue Line here So we had that the 13th of March
Basically just after the banks collapsed The market took off Bitcoin took off and Yes there is a narrative behind it that It's because people are fleeing the Banking system etc etc forget the Narratives just focus on the charts the Narratives are there to confuse and add Noise to the markets because one day That is going to be positive news that Banks collapse it's good for Bitcoin if You're in if we're in a bear Market that Would be bad news that's why we avoid The news narratives so it's been two Weeks above this line maybe we come back And test the hire which also works out Pretty well with those previous tops Those double tops that the market broke Through on Extreme volume so it's a good Nice safe place for the market to find Support again at least test the Possibility of support at around that 25 25 and a half thousand dollar level it's Also above the 200-day moving average Which found a fair bit of rejection on The way down now it found beautiful Support on top of the log downtrend and Bounced off that during this is the Weekly bar here that was during the Banking collapses all right that's that Week there you can see how strong that Move was out of the lows of the banks Collapsing so a good sign there Especially with that strength in the Volume as well so are we starting to see
That five trillion dollars trickle into Bitcoin well of course from the chart Here it would say so there's got to be Some money coming back into this because The Market's nearly doubled in the space Of a few months going from 15 and a half To testing those limits at around 29 000 Now So eventually this money starts to Find its way back in especially if Investors are getting more comfortable With buying stocks as though stock Markets are putting in higher lows they Start to flow over into more riskier Assets like Bitcoin and the whole cycle Of gambling on risky assets continues Because you've got bigger multiple Returns in something like Bitcoin and Crypto compared to the S P 500 and so We're starting to see that on these Particular charts as well the price is Increasing putting in higher lows some Of the other indicators which are also Showing the money is flowing back in Things like the RSI you can see we have These at the bottom basically touching Beneath the 30 Mark coming back to the Midline 50 and then you've got your top Line here at about 70 on the RSI Happening at the lows time and time Again the yellow line in this case not Necessarily the log the log downtrend It's not anchored exactly to it like we Do you can see the market break out of Those zones and then essentially go on a
Nice start to that bull market so it's Still early days in this case another Couple of indicators here the ichimoku Cloud it is entering that cloud again For the first time typically it runs to The other edge of the ichimoku cloud and Eventually puts in that next bull market Like you can see multiple times here There was a bit of a problem through 2019 2020 obviously the pandemic here But essentially it's the start of that Bull market according to this indicator As well well if you stuck around this Long thank you very much much Appreciation to you guys just like the Appreciation to you guys on Twitter as Well when you turn bearish talking to me At the beginning of 2022 I unfollowed You big mistake of mine I appreciate Your hard work your YouTube's are so Insightful so thank you very much for Your kind words I really appreciate it And for you your comment today question Do you think Bitcoin is more likely to Hit a hundred thousand dollars or ten Thousand dollars now you probably know My answer based on the previous videos But I want to hear from you guys in the Comments section 100 000 or 10 000 What's more likely to occur next for Bitcoin I'll see you guys at the next Video don't forget those links down Below and that 300 bucks from Big buy Bit and bitget ending in three days I'll
See you at the next one until then peace Out