🏆 Free Crypto & Economic Report Emailed To You!
📈 TIA Gann Swing Indicator
🔐 Crypto Storage LEDGER
▶ Subscribe to the channel for more macro market analysis on Bitcoin, Crypto, Stock Markets and Real Estate Cycles.
Subscribe to Michael’s Channel
UP TO $48,755 FREE! Crypto Exchanges
🥇 ByBit Free $30,030 + 0% Maker Fees (NO-KYC)
🥈 Bitget Free $8,725 (US + Global Users NO-KYC)
🥉 OKX Bonuses $10,000 (US + Global Users No-KYC)
🇦🇺 Swyftx, Best Australian Crypto Exchange
▶ My Official Socials ◀
YouTube
Instagram
Twitter
▶ My Must-Have Crypto Resources ◀
Education – TIA PREMIUM MEMBERS, Trading Courses & Exclusive Community
Charting – TRADINGVIEW ($30 Off)
Storage – LEDGER
Tax – KOINLY (20% Off)
Trading – TIA GANN SWING INDICATOR
This video is for entertainment purposes only. It is not financial advice and is not an endorsement of any provider, product or service. All trading involves risk. Links above include affiliate commission or referrals. I’m part of an affiliate network and I receive compensation from partnering websites. #crypto #bitcoin #cryptonews
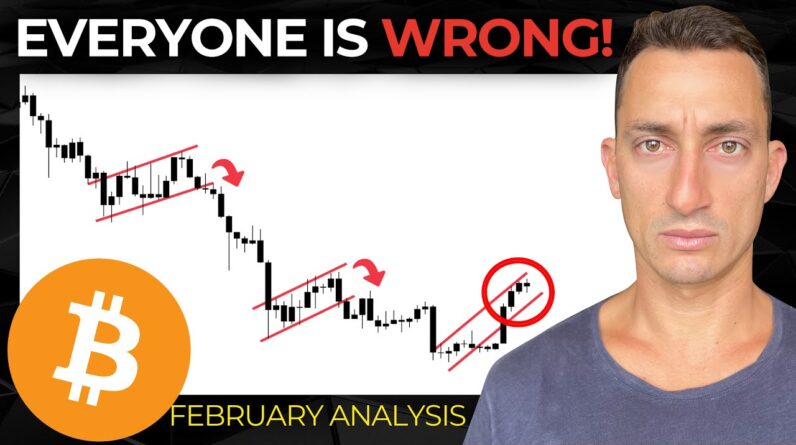
Bitcoin has been heading up for several Weeks straight and eventually these Moves must come to an end so is February The month that this move ends let's take A look at that in today's video using Our gamswing indicator our monthly cycle Analysis the vix the Dixie and a look at The S P 500 for a more macro level Indication of what to expect if you guys Haven't already Smash Up the like button Subscribe Bell notification icon and if You are wanting to get in with our Tia Premium members check out the link in The top of the video description our two Year sale is nearly over that's right Here TI crypto.com check that out Link In the top of the video description all Right guys enough with the shills for Now let's have a look at what's going on With BTC for the month of February I Know we're at the fourth right now so we Need to get on with what's happening First I want to look at a monthly cycle Analysis of Bitcoin with the years that We currently have involved in terms of The data so we're looking purely at the Data and then I'll give you my opinion Towards the end of the video and Potentially sprinkled throughout as I so Often do so this is the first year that We're looking at here this is 2023 Obviously no data this is what we are Trying to forecast Last year we had February 2022 it was a
Green month but I want to note here that The month didn't well the following Month didn't move that much higher Compared to what we currently saw uh in February so you can see the top here of The bar and then the March bar didn't Really go that much higher this is going To be a key piece to what I think is Coming for February of 2023 just based On what we have seen in the past Especially after significant moves like We saw with January in 2021 we saw a Pretty good all-time high price followed By March and April but like you can see The top to the top of April for the All-time high at that time was only 11 Between those three months the top of February March April just 11 so the Market basically stopped pushing so much From February into March and April so There really just wasn't that much Energy left in the market before we saw A major reversal in 2020 we had a move Up in January so a nice move from a low That formed in November and December and The market pushed up into a top on February before falling over with the Pandemic low if we didn't have a Pandemic low the market was already Starting to head down so it may have Been a higher low rather than a Breakthrough lower low before the market Basically bounced pretty hard out of That low so nonetheless there was
Basically the stopping volume and Stopping price around February going Back to 2019 we can see that the market Again formed a low around November December We had January just going sideways February again sideways March sideways Before we got that breakout so there Really wasn't too much activity going on In February going back to 2018 we did Have a big bounce into this low which Formed a dead cat Bounce from February And then the following couple of months The all of the price range of those Months was contained within the price Range of February so not much happened After February at that point however in This case February actually did have a Bit of a strong move to the downside but Remember that was at the the beginning Of the bear Market going back to 2017 Right in the middle of a nice solid bull Market this was a bit confusing for a Lot of people not knowing whether this Was the end because it just started to Break through the previous all-time high The market then reversed into March so We're concerned with what's happening in February and just as a measure from the Top of January to the top of February it Was only a few percent at that time as Well so the majority of the move move Had already happened as it led into February and then of course March as
Well so from the top of February to the Top of March was about 8.8 percent so This is all coming together right now in Terms of what to expect for February and Then we'll get into some more shorter Term time frames as well February of 2016 all of the price data was contained Within the November bar like you can see Here so all of the move had already Happened and then the market needed some Time to decide whether it was ready to Go up or it needed to accumulate more And of course here it accumulated more Before the market then pushed again Going back to 2015 so this was the bottom of the Market we had that drop into January the Market bounced out of that and then Again had to go sideways to figure out Whether it needed to accumulate more or Distribute before it was to fall but in This case it obviously accumulated Market went up from that point so February the move had already happened Prior to that and February was basically The month of figuring out where it Wanted to go from that point going back To 2014 the start of the bear Market you Can see February was a significant month You saw a big drop from December January Was trying to figure out what happened And then February it decided what it Wanted to do very similar to what Happened in 2018 you saw the peak in
December January trying to figure out What it wanted to do from that point Obviously it was trending down but the Big move from February to the dump and Then the bounce out of it again into a Dead cat bounce was basically the end of That first move before the market then Went basically sideways and down going Back to 2013 this is where things get a Little bit different so this is in the Midst of a bull market here so kind of Like 2017 where the market was just Heading up February was another good Time when the market just kept going and Didn't look back from that point 2012 we saw the market again No real movement there and it was Basically an accumulation period before The market decided to move higher again 2011 wasn't too much of a move higher From January so top to top you can see It's 30 but remember these are very very Small prices at the time and the uh January Top was 85 cents leading to the Next top of a dollar ten crazy numbers For Bitcoin but you can see here February was a new top in this price Range here but then March basically held The line at that point and there wasn't Really too much movement from January Into February what we can estimate from This especially after a low a Significant cycle low potentially the Cycle low and then a significant move
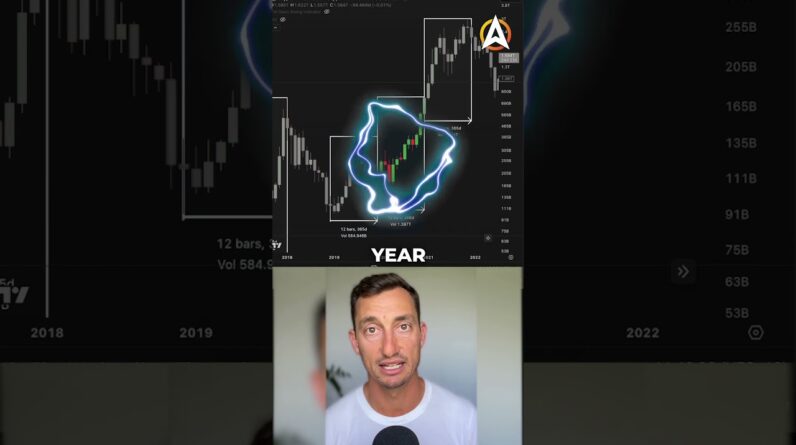
Out of that low being January what Typically happens is February isn't a Very strong month to the upside doesn't Mean we won't get any upside because of Course we have had some upside it's been A higher month than in the previous Month in this case by one percent maybe We go that extra mile and take out that August top which could potentially give Us a five percent uh growth from the January Top or we come up and start to Test some of the previous resistance Levels that were set back in June 2021 That would give us a 20 upside from the January Top but that might be getting a Little bit too excited for the month of February maybe we see that later in the First half of 2023 so like we saw Looking back basically out of the month Of if January was a significant move to The upside out of a low we saw that February was kind of that turning point Or not much happening so essentially the Message here is avoid the fomo at this Point maybe we do see some slightly Higher upside but it seems like that in Terms of the timing aspect it's just Running out of steam and with that in Mind let's drop it down a time frame Here and have a look at some more recent History for what's happened on bitcoin Getting an understanding of that time Cycle so we're going to measure from the Bottom to the current top and this is 10
Bars so we're trying to figure out Whether it's worthy of getting involved In the fomo now and hoping that this Move that we've seen for the last six Weeks from late December into January or You know early February continues on and We're you know we're going to miss out On another 50 move or is it probably More likely that the market is running Out of steam to the upside for now in a More micro look at the market maybe on The daily to the weekly time frame which Means that we can wait and look to see Where the market pulls back if it pulls Back to anything significant like we Looked at in the recent videos maybe it Only pulls back to the previous tops at Around 20 odd thousand dollars maybe We're lucky and we get to 18 or anything Under 20. but if that doesn't happen and This starts to to Trend sideways which Is what the data is showing February is A reasonable time if January has gone up For it to potentially track Sideways relatively speaking then we Could get ready to get on that next Bandwagon for the market to move up now A massive note to that we could also see March do the same sort of thing track Sideways or maybe dip its head a little Lower so we have to wait to see what Happens at the end of February but for Now just looking at February it looks Like we're probably running out of steam
Which may mean we just track sideways There's option one or we dip lower That's option two that's just looking at The the data so we just looked at this Being that we're up 10 weeks from the Bottom before we've seen a significant Reversal let's go back and look at where These red markers are from the bottom to The top that was nine weeks so bottom to Top nine weeks we can take this off the Chart now and then going going back Again for the last significant move in The bear Market bottom to top nine weeks Again so in each of these cases within The bear market we've had nine weeks From the bottom to the top We've had another nine weeks bottom to The top and we're now currently sitting At 10 weeks bottom to the top that would Be a good time to see at least a pause In the market Direction a pause in the Price increases and for the market to Decide what it wants to do next maybe we Track sideways for February or into the Early part of March maybe we do get that Slight dip with some sort of bad news That is is due to come out in the future But essentially the timing is saying a Potential pause or a potential dip I'm Leaning more on the side of a potential Pause possibly somewhere down to these Higher levels here that probably Somewhere to around that 20 or 21 000 Level so that's my opinion based on the
Data that the chart that the market has Given us let's see if there's anything Else that supports this look at around 8 To 12 weeks somewhere within that two Months period of a market moving in a Particular direction before it gets a Corrections or a move against that that Particular Trend now there's another Point in the market here basically after This covered crash dump uh you know the Sellers had again dried up and the Market moved pretty quickly out of that Low so I'm using that as a time frame You've got eight weeks to this first Peak before the market reversed and all You could use this time frame around 12 Weeks so if we go to the eight week Point here you can see that the market Basically stopped moving up from that Point in terms of a percentage move from The top of that bar that was in May to The top of the the next top here in June There's only a 2.8 move so really you Could say that the move out of the low All the energy had been used up in that First part which was around eight weeks And then this was basically the market Tracking sideways just buying time Catching up in time before the next move Was ready to begin so that that's what I Want to look at when I'm comparing past Market data to the current market data This is a little bit more subjective What I've used at the beginning of the
Video was more objective just looking at What's happened in the past already but This takes a I guess a little bit of Skill depending on your you know your Skill and how long you've been in Markets with what you're comfortable With using in terms of the the data from The market looking at the stablecoin Supply ratio oscillator it's from glass Nodes here we can see a pretty big Uptick in the stable coin Supply ratio So basically this is stable coins being Deployed to the market now often when we See a big move from stable coins being Deployed into the market There is the price increase of Bitcoin You can see in each of these occasions Some pretty significant rallies have Occurred obviously we need to get a Pause or a time where the market will Basically reverse from this point that Doesn't mean that the prior cycle lows Will be taken out but it does mean that Eventually the money needs to stop Flowing for a period find out what the Market wants to do next before the smart Money is ready to decide whether they Want to keep dump in the market or if It's time for the market to continue up Again and so look at the stable coin Supply ratio lets you see when this Money is coming in and when it's coming Out and you can see back here in May Which I use as an example in today's
Video that the stablecoin supply went up It came back however the price range did Not come back very significantly and This could be what may occur this time Depending on whether you believe that we Are in a mega bear trend and once it's Uh the stable coins come out of Supply That we go on this big drop in price so The black line is price or if you Believe we are more in an accumulation Period or transitional period which I've Talked about on the channel before where Even though the stable coins may come Out of the market the price of Bitcoin May just Trend sideways until time is Ready until time catches up to when that Next move is about to take action now There's a few more things that we wanted To cover to potentially support this Theory we're looking at the vix this is Of course the volatility index for the S P 500 we are seeing a pretty significant Downtrend here and like we've covered Many times before Once this drops below 17 what we've seen In the past is a move up on the S P the Volatility is dropping meaning there is Less craziness going on in the market And it is tracked between 11 and 17 on Many of the previous occasions where the S p was climbing so as the s p climbs People are more interested in investing Or trading in riskier assets and crypto On bitcoin are riskier assets at this
Point in time so you can see here when It's between 11 and 17. these were those Times in the market where the s p was Trending up yes we have some spikes out Of it these are Market bottoms and these Are also some Market bottoms as well but Less significant and these are the times That we want to see on the vix for the s P to continue climbing so that's what we Are currently looking at right now it Climbs on low volatility so those two Pieces are coming together to Potentially support the theory of Bitcoin at this point and the other Piece which has been working out is the Dollar has finally bounced from a low Point here of a 100.8 so you know we've Been tracking this for quite some time We've looked at the top being September Uh basically calling that almost to the Day at least putting out a warning Believing that that was the top for many Reasons that we've looked at already Market has finally come back down and We're seeing a reversal here on the US Dollar and we know that this often leads To some pullbacks for crypto and Bitcoin However for now at least Bitcoin has Been quite resilient to the move up on The USD so the USD the Dixie is moving Up normally we see Bitcoin drop but it Is acting quite quite resiliently at This point in time so that could mean That we do track sideways while the US
Dollar goes on its its moved to the Upside finally it's expected rally that We've been looking at for this entire Time for the downside we were expecting Approximately one to four week rallies Which is what we've seen in the past This time frame works out relatively Well with Bitcoin as we've seen in the Past it could be the month of February That Bitcoin tracks sideways or slightly Down maybe we lead into that final drop Into that March April period which we've Talked about before and we can basically See a little of this analysis coming Together with the market cycles of the Dixie the s p the vix of course the Volatility for the s p and how this is Playing out in the price chart of Bitcoin and what I'm expecting here so Essentially after looking at all of that Objectively subjectively some of which Is my opinion and how I'm playing the Market because at the end of the day I Am an investor and Trader and I have to Put my money in the Market at some point Or keep it in USD which is essentially Still in the market you know I'm just Playing at the whim of whatever the US Dollar does what I can see from this is We're probably due for a pause Or a correction in this rally so a bit Of a pullback and it seems like the Timing is about right for February to Have a top which we're currently on this
Week maybe we go that little bit higher Maybe we don't and the idea here is that We potentially track sideways as a best Case for the Bulls or if you're looking To buy some more maybe we get that Pullback which we'll have a look in Future videos if you've been enjoying The videos and they've been helping you In your investing let me know in the Comments section with a cash Emoji cash Bag otherwise Smash Up the like Subscribe to the channel I'll see you Guys at the next video and don't forget To subscribe to our free Alpha report And of course our two year anniversary Sale which is almost over so get into That now I'll see you guys at the next Video Until Then peace out