🇦🇺 (LIMITED TIME $20 FREE BTC) Swyftx, Best Australian Crypto Exchange
🏆 Free Crypto & Economic Report Emailed To You:
👾 Free TIA Community Discord:
📈 TIA Gann Swing Indicator
🔥 TIA Premium! Trading Courses & Exclusive Community
▶ Subscribe to the channel for more macro market analysis on Bitcoin, Crypto, Stock Markets and Real Estate Cycles.
UP TO $38,755 FREE! Crypto Exchanges
🥇 ByBit Free $30,030 + 0% Maker Fees (NO-KYC)
🥈 Bitget Free $8,725 (US + Global Users NO-KYC)
🇦🇺 Swyftx, Best Australian Crypto Exchange, $20 Free BTC
▶ My Official Socials ◀
YouTube
Instagram
Twitter
▶ My Must-Have Crypto Resources ◀
Education – TIA PREMIUM MEMBERS, Trading Courses & Exclusive Community
Charting – TRADINGVIEW ($30 Off)
Storage – LEDGER
Tax – KOINLY (20% Off)
Trading – TIA GANN SWING INDICATOR
Channel Sponsor: New Brighton Capital, Aussie SMSF specialists. Book your Free consult and use code “Pizzino” for $200 credit off:
This video is for entertainment purposes only. It is not financial advice and is not an endorsement of any provider, product or service. All trading involves risk. Links above include affiliate commission or referrals. I’m part of an affiliate network and I receive compensation from partnering websites. #crypto #bitcoin #cryptonews
Something massive is brewing and I'm not Talking about what you do when you get Up in the morning something big is Coming in the markets and most are not Prepared for it we know this purely from The market sentiment going on out there In the world of Finance so what is it And how can we best prepare for it just Want to go through in today's video We're looking at the objective data and Sprinkling some of that subjectivity as We look through the Wall Street cheat Sheet and then bring it back with the s P transitional period the vix the NASDAQ Which has done something absolutely Phenomenal in the last few hours and Finally how the Wall Street cheat sheet Is most likely wrong with Bitcoin Investors right now I want to show you That the end of the video so first up Like And subscribe thanks again for all Of your support out there let's dive Straight in to the first piece and what Has happened in the last 24 hours for The S P 500 as we go through our morning Routines looking at these markets the S P 500 has closed again Above the 50 level this is that key Level that we've been waiting for in This shorter term time frame as the Market bottomed again on the 13th of March which was around the exact period Of the banking collapse so all of that Banking collapse crisis noise jargon
Going on in the market the the S P 500 Is now up 5.7 from that low and if we Take a measure from the October low Going all the way back to 3 500 points The market is now up 15.88 so pretty Decent moves from these lows and the Volume has remained pretty well intact Exactly what we've been looking at we Pay particular attention to the volume Because this essentially gives us that Idea about what the smart money is doing In the markets now I do know that there Are plenty of people talking about the Smart money hasn't come back and the Institutions aren't buying yet someone Is bloody well buying because you've got A ton of volume at these lows like we Talked about with September and October It doesn't mean that we can't go past Those lows to a shorter effect maybe we Test those lows and break back above That's always a possibility just like What happened in October but what you'd Want to see if that did happen is Exactly what we saw in October I moved To the downside then you've got this Wick right here and then a big push back To the upside it's basically testing any Supplier that's coming into the market At those low points like you can see Here we've got very significant volume Coming in at these March lows which was The most fearful time that we've Experienced in the last few months with
The banking collapses these banks that Most people have never heard of until The news came out sure there is Credit Suisse out there sure there is Deutsche Bank those charts which I've shown you On Twitter go and follow those links in The description those banks have been Down for 16 years what thinks that Those banks are in good health if their Chart is just sliding down for 16 years I'll let you answer that one there but Seriously the point here is to keep Watching the charts and this is what We're seeing today as we close above the 50 level this is a really good Short-term sign to continue mounting That case to get back to the 4200 Point Level this is where we've been rejected Before in February and now it looks like We're on our way back there again as we Close above the 50 level this is the Short-term stuff obviously over the next Few days leading into the end of the Week we really want to see the next Couple of days close Above This level Because we haven't done that yet you can See here in March we had two closes but Even that second close was quite weak as We pushed up and then back down later in The session With the next day following right Underneath and that's where we fell into That banking crisis which really at the End of the day has now been overcome in
Terms of the price on the chart so the Next one we only closed up above it once Got slammed back down but fortunately we Put in a higher low and now we find the Market back above it again for a third Time so hopefully this is the the chance That the market has to mount another Attack at 42 at least for the Bulls and In the case of the Bears they obviously Want to see this get back underneath the 4 000 level rather quickly over the next Day or two and close out the week under This level that would then put this in a A less strong position and then we would Have to look further down to where that Next 50 level is probably somewhere Around the 3 900 points what else is Going on out there the vix the vix Collapsed overnight another four percent Remember what we're looking at here when It comes to what happens with the vix The volatility index when this goes up The s p goes down when the vix goes down The s p generally goes up and then once It breaks into this zone of around 17 or So points it can happen at slightly Higher levels but once it breaks between 11 and 17 this is usually the case of a Bama a bull market continuing to go up Like we saw here it is 2021 through to 2022 you can see that we were touching In this with just the odd move to the Upside of around 25 or so points that Essentially is your bull market that's
What you want to see in the volatility Index and right now we've been putting In lower highs which means volatility is Dropping which seems like it's preparing For another bull market doesn't have to Go absolutely bananas but we could have A slow grind on the way up after a few Quick moves and then you've got a pretty Slow grind up some scares to the Downside more slow grind up scares to The downside that's what it looks like It's setting up for at the moment and You know we've been talking about this Since these Tableau since these June Lows the strength for the s p the area That most are not prepared for is if This Market gets back above 4 200 points You can bet your bottom dollar the Bears Will be calling this another massive Ball trap they'll be calling it a ball Trap all the way up to the double top And you'll probably get rejected and They'll say it's back on but that's just Getting us prepared for what the media And what the Bears are going to say at That point the Bears have their best Chance right now they need to break this Back under 4 000 and get back under 3 800 points this is all those critical Levels right here they have to do that Very soon they could in fact do it they Could do it if we just trade around These levels for too long but at the Moment we're starting to mount an attack
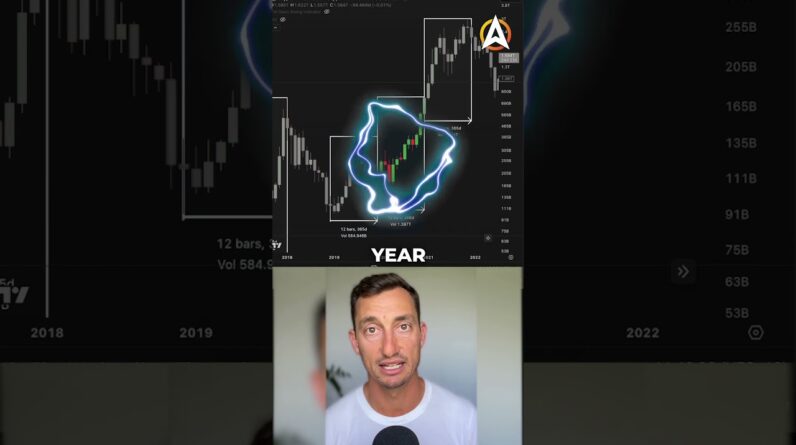
At the 4200 points so it's always Important to keep the an open mind but You have to be on one side of the fence In order to make your trades so you keep An open mind for both this is what Traders investors do look at both sides Of the equation but you have to then Take one Side based on your own analysis Otherwise you'll never enter a position Over to the NASDAQ and what it has done In the last 24 hours is close above all Of the previous closes During the period Of March February January December November October and now we are coming Back to some of the highest close is It's had since September or even late August of 2022 so looking at this close Going all the way back here to this bar On August 25th that is seven months ago We checked this out on the weekly chart Now on the daily as well we are closing Up at very high levels not only is that Impressive we've bounced off the log Downtrend which was the bear Market Downtrend that was holding the NASDAQ Down from the tops this is slightly Weaker than the s p 500s it did drop Lower than the s p did at those times And that's what we're talking about on The channel but since then November put In the load December put in another low And now we put in that higher low again In March above the log downtrend and Above the previous resistance levels now
The next really strong part here at Least for the daily so short term again We're closing above our 50 extension so The extension here is 12 900. that's This major swing from the low to the top We throw in our Gan swing indicator look At it on a weekly chart to bring us back Out to the the macro you can see this Low to the high extended from that base Again which gives us our profit Target Levels and areas of resistance at least On the way up the stair step up this is A very strong move so far and on the Weekly we definitely want to see the Weekly close back above 12 900 and we've Got two days to go for that so keep that In mind looking at the strength Continuing to build while the rest are Missing this day by day week by week Just reading news headlines of how Fearful the market is and I see it in The comments section people still saying How can this happen and it's not it's All going to collapse because of how bad The sentiment is or how bad the news Headlines are or what's going on in the Economy I urge you stay focused on the Charts and just watch what where the Money is going this is telling you where The money is going it is now going into The markets at higher and higher and Higher levels it doesn't matter what the News headlines say it doesn't matter What's going on the economy if you want
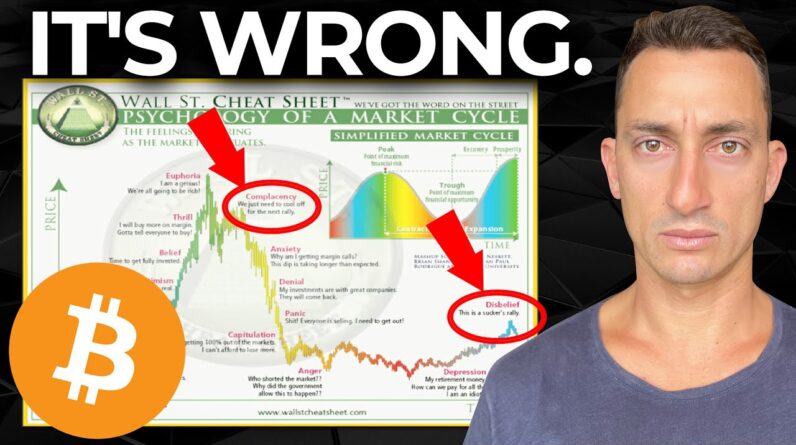
To be investing or trading on a chart The economy different story if you are Worried about how to pay for groceries And bills which are all important things But we need to separate those two we're Trying to trade and focus on the charts And look at the macro Cycles here the Money is going into the market at higher And higher levels no matter which chart We look at here the s p October lows November lows December lows March lows Okay so these things are still intact And like we said even if we get some Quick Wicks down you've got to watch the Major lows at the moment which uh October for both of these markets now This is where a lot of the market could Be entirely wrong when it comes to Bitcoin and the Wall Street cheat sheet The psychology of a market I'm sure You've seen this before I've brought it Up plenty of times on the channel but There is a big difference in the way People are using this chart at the Moment I want to go through that now but If you're finding value make sure you Like And subscribe it does go a long way To helping out the channel and this is What we go through with our members I've Got some massive stuff coming up so if You want to get on board with that Link's in the top of the video Description for our Tia membership so if We go through investing in macro cycles
And trading cryptocurrencies all coins Bitcoin leverage or spot entirely up to You so the Wall Street cheat sheet I Think this is being done almost entirely Wrong by the majority of people they put This transparent chart in the background Here basically you save this and then Drop it into your trading View using the Tool on the side here which you probably Can't see essentially drop it out here Image drop it into your chart and then The only thing you can do is just extend This thing in or out and then it's Basically just trying to line it up and Say well we are now in a area of this Sort of area here so we've dropped into Anger and now we're coming out and we're Going to drop all the way down into this Low point and get a lower low I think That's entirely wrong I think it's Probably better to line it up with where Those low points are and if you believe That the November low is the low line That up with the low here on the chart Now I've had to make this small so it All fits in so I've just blown that up a Little more so we can see it in line With where these lows are now I'm using The anchor points of the top and adding This low here in this chart all the way Down to the bottom here after that X FTX Collapse so we had the collapse here on This red candle and then we rolled over For a couple of weeks before we put in a
Higher low and the market basically Boomed out of that low point so what I Think everyone's getting this entirely Wrong is that they're expecting the the Wall Street cheat sheet to be exactly The same as the market and not fractals Are never exactly the same they're just There as as guides and so when you start To use it to be exactly the same that's Where things can essentially go a little Wrong just like here it's just as soon As it starts to adjust it's completely Wrong so looking at this low for the Wall Street cheat sheet this red area in The background just after the FTX Collapse putting that at the low then You can start to see that we had a bit Of a trickle-down effect into that final Drop then we also had this little Trickle down into this low but of course Through the Bitcoin bear Market this was Quite quick it was very very severe so It's almost as if that piece the Complacency the anxiety the denial the Panic the capitulation was all much Quicker than what it's showing up here On the complacency or This area of anger all the way down into That depression happened much quicker Than what it is on the Wall Street cheat Sheet so you would have to compress the Wall Street cheat sheet to be at the low Here around the anger squeeze that up And then this part here the top would be
A little bit further back so we drop Down there's the first drop into the Complacency top so you've got this Complacency top and then this Complacency top this one here in late March early April was the Bitcoin Conference in Miami of 2022 if you Remember Michael Saylor was there you Had Peter Thiel which I've talked about Many times before there's plenty of Articles you can look at where Peter Teal was talking up Bitcoin and Cryptocurrencies Meanwhile we're selling Billions of dollars through that drop or Through the peak itself it's getting out Of his positions through this period Here selling Bitcoin selling the cryptos Whatever he had in the portfolios I Believe from those headlines he made a Billion or a few billion either way it Was in the billions okay so they were Selling but they were talking about how Good Bitcoin was at this peak here that Is pure complacency we just need to cool Off for the next rally it's going to Come but it doesn't and we drop past That point so that's where the anger is We drop through those areas of denial Anxiety Panic it's all through that Period there of lunar going down UST Going down that's you know anxiety and Denial it was definitely felt through That period then we had the Panic of uh The the contagion of that spreading
Across Celsius Voyage uh block fire and Anyone else caught up in that particular Scare there we go through the anger Everyone's angry at dokwan okay so anger Is this bottom period here which you can See in the background chart starts a Little further back so move that forward And then we get all that anger built up And we drop into that final anger of FTX Going under and we get that drop now it Starts to put in higher lows you can see Here we put in those higher lows and Then we get a push out and guess what The feeling is now we're in disbelief it Seems like a lot of people are in a Disbelief that this could be the start Of a new bull market and and they say That there this is a sucker's rally Everyone is talking about being a Suckers rally at least if you're on Twitter following over there where I'm Semi-trolling some major accounts there Who are still talking about this being a Suckers Rally or the biggest ball trap Of all time I believe that that is pure Disbelief in this particular rally take A step back and look at depression it Was definitely depression after FTX Through that period of November and December this little area here where the Price range only went from basically 16k To 17 and a half it moved about a Thousand and a half bucks for uh six or Seven weeks that was definitely
Depression most people's money had been Entirely wiped out as the majority People are in the US who are trading in Cryptocurrencies they had a lot of money On FTX because of course ftex is one of The bigger exchanges there they had a Lot of money in blockfi and Celsius and Voyager they're all American companies Promoting to everyone all the time and All of that stuff went down so that is Definitely depression my it says right There in the background my retirement Money is lost how can we pay for all of This new stuff I'm an idiot that Happened through that period after FTX Obviously it continues on through the Next stage because people haven't had a Chance to build up their portfolios Again or get some money to invest into The market Let the market won't wait for them so This is why I think we are coming Through depression into this next stage Of the disbelief and then after the Disbelief happens we get into that hope And recoveries but that is going to be 12 18 months away and we'll probably go Through multiple of these Cycles the Entire psychology multiple times maybe Once or twice let's say that until we Build up to break the new all-time high Again we'll get up again we'll hit some Euphoria with the bulls as we attempt 35 000 or 40 000 then we'll come back into
A complacency bounce no we're going to 50 it's going to happen and then it will Dump again and probably come back and Test some of these lower levels at who Knows twenty eight thousand twenty five Thousand but that that seems to be what Will happen over this particular period Now I don't want to end that piece with I could be wrong but I want you to go Away and settle this for yourself decide Whether we're in a disbelief Rally or Maybe it's a complacency rally again That's up to you I've got my view of What I think is happening based on what I've just explained there based on what We've looked at in terms of the s p Potentially getting back past 4 200 Eventually which would really swing this Stuff into the Bulls and of course we Need to see this for the stock markets To also increase in value as well same Sort of thing for the NASDAQ that's why I have this belief that we are most Likely going through a disbelief rally But you need to do this for yourself let Me know in the comments section what Your thoughts are which area of the Wall Street cheat sheet are we in at the Moment and while you do that like And Subscribe I'll be back here at the next Video links in the top of the video Description for our Tia premium Membership so we go through this in Great detail on how to trade crypto and
Invest for the long term thanks once Again guys see at the next one till then Peace out