🏆 Free Crypto & Economic Report Out Now!
📈 TIA Gann Swing Indicator
🔐 Crypto Storage LEDGER
▶ Subscribe to the channel for more macro market analysis on Bitcoin, Crypto, Stock Markets and Real Estate Cycles.
Subscribe to Michael’s Channel
UP TO $48,755 FREE! Crypto Exchanges
🥇 ByBit Free $30,030 + 0% Maker Fees (NO-KYC)
🥈 Bitget Free $8,725 (US + Global Users NO-KYC)
🥉 OKX Bonuses $10,000 (US + Global Users No-KYC)
🇦🇺 Swyftx, Best Australian Crypto Exchange
▶ My Official Socials ◀
YouTube
Instagram
Twitter
▶ My Must-Have Crypto Resources ◀
Education – TIA PREMIUM MEMBERS, Trading Courses & Exclusive Community
Charting – TRADINGVIEW ($30 Off)
Storage – LEDGER
Tax – KOINLY (20% Off)
Trading – TIA GANN SWING INDICATOR
This video is for entertainment purposes only. It is not financial advice and is not an endorsement of any provider, product or service. All trading involves risk. Links above include affiliate commission or referrals. I’m part of an affiliate network and I receive compensation from partnering websites. #crypto #bitcoin #cryptonews
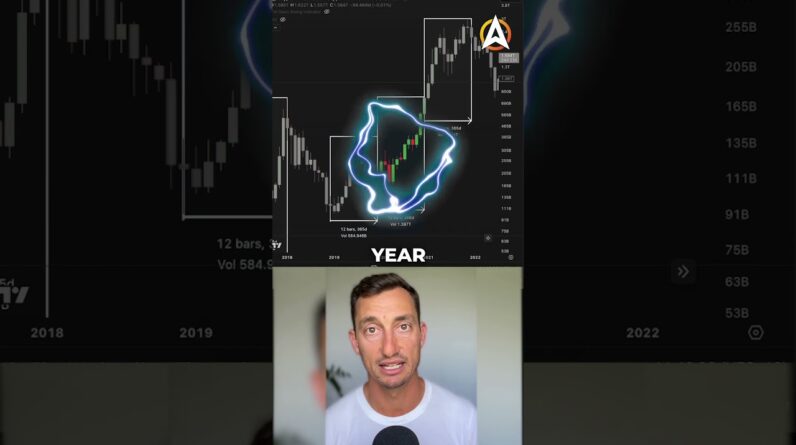
2023 has gotten off to a flying start And some could argue that the second Half of 2022 actually was not anywhere Near as bad as we were led to believe And as we start to climb out of these Lows that were set in the second half of 2022 we find ourselves breaking critical Resistance levels in charts and Indicators which shouldn't be breaking In a recessionary environment now of Course we could still be slightly early But when we're investing that's the risk That we take so in today's video I want To go through these indicators things That are breaking to new recent higher Levels stuff that shouldn't be happening In a recessionary environment how can we Play this in the markets ourselves our Macro portfolios looking at real estate The stock markets and of course the big One the old BTC and cryptos if you Haven't already gotten to that drill From watching YouTube videos and acting Like a monkey like subscribe down Notification icon and if you want to get A copy of our free Insider report coming Out today less than 12 hours check out The link top of the video description of Course where else would you find it Right there Tia crypto.com forward slash Subscribe and while we're here the last Shows to our Channel sponsors the Cryptocurrency exchanges buy bit bitget And the Aussie one there Swift decks as
Well stay safe out there yes there are Tons of sign up bonuses but don't keep More in exchange than you can afford to Lose whether we're invested into real Estate or not it is extremely important To watch what is happening in the real Estate sector in this case it's the home Builders the home builders are going up If the ETF is going up there's obviously Some of these builders that are making Money they offer of profiting from the Sales of the property they're profiting From the land appreciating in value and That is showing up here on the chart and So this one came up as we broke through Our 50 level we also broke through our Monthly swing top here as well that was Set back in August and we now start to Climb towards what was previous support And the breakdown which then becomes Resistance and so we're now on the way Up to test that level and hopefully by The end of this week we break through That and close above the 69 level now This isn't something that happens in Recessions we don't often see home Builders making money what usually Happens is they start to decline because The land prices have become too great And the financial system begins to Unfold usually on the back of real Estate prices being far too high and That's not what we're seeing at the Moment we do get pullbacks in the market
Like we saw in 2022 but it looks like That's a pretty healthy correction Because it has come back to nearly dead On the 50 level and we know from Experience that 50 is a fantastic Balancing point in the market it's a Good area for markets to reset before They take off again so we look at the Low from the covert crash to the peak in Late 2021 early 2022 this Market came Right out on 50 percent some would call This a double bottom either way it's Still a higher swing low which is also Quite bullish and now we've broken past That swing top so we've got a major Uptrend in play here now this isn't to Say the Market's going to go straight up To new all-time highs it's never about That because we understand that we do Get pullbacks along the way the main Question is what are we going to see in The next couple of weeks and we're going To see a rejection here at around 69 or 70 and a pullback or are we going to see This breakthrough and then potentially Pull back and test the upper side this Is obviously the stronger play this is Also an okay scenario if we hit the Resistance and come back to the midpoint Here what we don't want to see is Obviously the market breakdown so the Numbers to keep in mind between 50 and 55 that is going to be very very weak For the home builders and we could then
See further downside for the real estate Market which would then spill over into The stock market the financials and Everything else that is classified as a Risk asset so while this remains Relatively bullish and potentially Breaking Above This resistance that is Going to be a good signal that the Market is going to carry on in 2023 People are going to feel a little more Confident in their Investments and Potentially start to layer in to to the Markets as I said just as a repeat this Is not going to happen in a straight Line I don't expect it to happen in a Straight line there's still going to be Some turmoil coming up probably in court The first half of 2023 which will get The Bears excited again but we just have To wait and see what happens from that Point the main thing is we're seeing Some breakthroughs in resistance levels Which was set back during a period where The market was very bearish an extended Look at this chart shows that the home Builders were forming a low above the Previous tops so you can see this top Back in 2019 2020 and then the previous All-time high around 2005 2006 before That GFC has acted now as support twice In the market you see that's around the 2020 as the market began to climb out of The quick Spike low and then recently in 2022 with that recent low that we talked
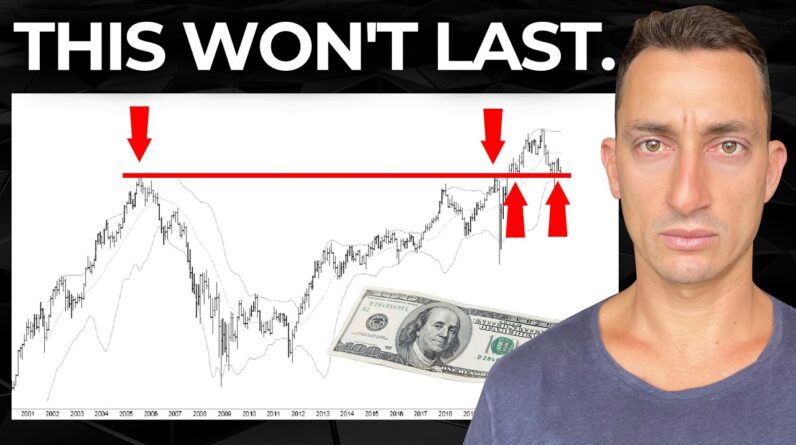
About on the channel back in the later Half of 2022 so right now we're starting To form a base above this level which we Know is a bullish sign these take months To play out expect some move to the Upside probably testing some of the Previous support and then we have to Watch to see if we can get past and Break those Tops on the chart these are All scenarios that we don't expect to Happen in a extreme bearish environment And in a major recession or Depressionary environment the market is Finding support at previous old all-time Highs this is bullish based on what We're seeing on the chart something else Which is quite bullish and I've alluded To several times on on Twitter uh other Markets around the world so other Indices in this case this is the UK very Heavy in the financial space so there's A lot of banking and finances and things Like that that make up this index here This index is nearly at its old all-time High price things like this should not Be happening if the market is about to Fall out of bed collapse into new lows We're less than two percent from the All-time high price and what this means Is that a lot of stocks that are in the UK are getting close to potentially Breaking out of their all-time Highs but At least putting in new recent highs the Same deal goes for Australia again
Within two percent of its all-time high Price while everyone's talking about Recessions and depressions the money That we can see here in these markets Are piling back in and pushing stock Prices up potentially in that financial Sector obviously Banks make money from Higher interest rates they're lending Out money to mortgages People are buying property even though We're hearing the opposite out there in The market people are getting out there And buying property profits are being Made in these particular sectors if Learning about the macro cycle how to Trade and invest in it for the long term And short term if that's of interest to You then highly suggest checking out the Link in the top of the video description For the email we're going to cover this In today's email newsletter report Looking at what's been going on for the Latter half of 2022 and then coming up In 2023 as well we also cover this with Our members we don't talk about crazy Moon coins or gift parties or any of This crazy crap that goes on in Bull Markets this is looking at specifically The macro cycle analysis and trading Cryptocurrencies it's also our second Birthday for the investor accelerator so You get more details in today's email on That if you wish to join with the Special discount on that as well so so
Far we've looked at two major indicators Things which typically do don't happen In recessions or at least that Recessionary environment the first being Home builders making money the second Being Financial sectors major Global Financial sectors increasing in value And getting very close to their all-time High prices now at least in this period I'm still bullish there are going to be Some short-term pullbacks so depending On your time frame could look quite Bearish but eventually we will get a Major economic collapse it's just not Time yet based on what money is doing in The markets and the third indicator Which is why I don't think we're going To get a major collapse this year is That we are a pre-election year so the Presidential election cycle Theory Versus historical market performance so Remember we have a presidential election In 2024 we're now in 2023 which means It's the third year of the cycle leading Into that final year and it's the pre Election year which is this one right Here the third year this on all accounts When you look back 50 years 100 Years of Data typically is one of the strongest Years and seeing as though the second Year was actually negative it makes uh For a case of it being actually even Stronger you usually get those bounces Out of the lows so this is potentially
Going to exceed that 16 of course we're Early days the first month is now over Of January and we've had a pretty strong Month but the third year of these Cycles Is also quite strong so typically over The course of many decades this has Proven to be another strong year within The cycle now as investors or Traders we Need to have a look at both sides of the Market of course we take one side of the Market because our money needs to be in Or out depending on if we're only long But at the same token we need to be Prepared in case it goes against us in Case the unforeseen happens and in this Case we're looking at the s p obviously The major Market of in the world here we Have broken out of the bear Market Downtrend but we're coming up towards Some resistance here so this is the lows Of February March and April before the Market broke down in May so we're Getting close to that level again a Breakout of 41.50 is going to set us up For some pretty good bullishness to the Upside but as always if we start to find Resistance for an extended period of Time and then come back to test the lows That could be the setup for the Breakdown but the point is to be Prepared for what could potentially come Next I've got a bias my bias is to the Upside based on what I'm seeing in the Market and that's essentially what
Everyone else has to do with their money If you've got your money in the market Your bias is to the upside if you are Out of the market your bias is to the Downside you were waiting for lower Prices so either way we're always in the Market we're either holding USD or fiat Currency and watching the market move up Against us which means our buying power Becomes less or we're in the market and Potentially watching the assets increase In value therefore we've made a good Investment call or we're watching the Market go against us which means we Possibly should have been out of the Market pretty straightforward that's the Reasons why we need to be looking at Both sides of the market and right now With the s p we're coming up towards Some resistance as for Bitcoin we have Now closed the month of January above The previous swing top of November and We're closing in on the next monthly Swing top that was set in August that's 25 200. so a big key level coming up for The Bulls to hopefully break and test And start to accumulate above if not at Least we've broken it and if we do come Back the idea here is we don't want to See it go any further than those Previous support levels that the market Had put in with the current strength in The market you wouldn't expect to come Back to that point but we can go through
Long periods where the excitement of the Recent move wears off and the Bears just Start to take control and grind the Market lower like what happened in 2019 The Bulls took control for four or so Months the Bears took control again for Four five six months and the cycle Rinses and repeats this was the Transitional period that we looked at in Yesterday's video so with that said Videos are popping up on your left hand Side here like subscribe Bell Notification I'll see you back here on The channel tomorrow for another update On the macro Cycles looking at the stock Market real estate and of course Cryptocurrencies links in the top of the Video description for our free report Coming out today don't miss out on that I'll see you back here tomorrow and Until then peace out