Join the Frankie Candles Discord! ➡️
📈 BitLab Trading Suite | Get access to the best trading indicators ➡️
Divergences are a huge tool that can be utilized to get into some really profitable trades. In this video, Frankie from @FrankieCandles breaks down how to spot bearish and bullish divergences and how to take advantage of them in your trades.
💱 Use this link to trade with us on BitGet, an exchange that puts users and security first. ➡️
NEW to crypto or NEW to the channel, join the BitSquad:
📚 Grab My Book ➡️
📚 Learn more about crypto ➡️
📈 BitLab Trading Suite | Get access to the best trading indicators ➡️
📺 DTEN Tech Solutions: For more information on these incredible digital whiteboards here ➡️
Protect Your Crypto in Cold Storage:
💳 BC Vault Cold Wallet ➡️
💳 Ledger Cold Wallet ➡️
💳 Trezor Cold Wallet ➡️https://bitboycrypto.com/deal/trezor
BitSquad Tools:
🧾 Need crypto tax help? GET 10% off CoinLedger tax tracking services with code: BITBOY ➡️
🔬 Research with Token Metrics ➡️
⚙️Lux Algo Trading Tool ➡️
🛠 Market Cipher Trading Tool ➡️https://bitboycrypto.com/deal/marketcipher
Represent Your Crypto Squad:
👕 Best Crypto MERCH ➡️
Come Stake On-Chain with The BitSquad:
🧐 How to join Cardano (ADA) BitPool ➡️
●▬▬▬▬▬▬▬▬▬▬▬▬▬▬▬▬▬▬▬▬▬▬▬▬▬▬▬▬●
Connect with Me & the BitSquad!
Join Me on Twitter ➡️
Join Me on Instagram ➡️
Join Me on TikTok ➡️
Join Me on Rumble ➡️
Join Me on Minds ➡️
●▬▬▬▬▬▬▬▬▬▬▬▬▬▬▬▬▬▬▬▬▬▬▬▬▬▬▬▬●
All of our videos are strictly personal opinions. Please make sure to do your own research. Never take one person’s opinion for financial guidance. There are multiple strategies and not all strategies fit all people. Our videos ARE NOT financial advice. Digital Assets are highly volatile and carry a considerable amount of risk. Only use exchanges for trading digital assets. Never keep your entire portfolio on an exchange.
#bitcoin #ethereum #crypto #news #nft #economy #money #blockchain #invest #inflation #cardano #cryptocurrency
Foreign My name is Frankie candles and in this Video I'm going to show you guys a super Super simple trading strategy that you Can use to get into some really Profitable trades now this is gonna Require a little bit of knowledge on how To read a chart and actually trade Crypto so if you're starting an absolute Zero I will point you in the direction Of the bitlab academy and if you want a Free resource to go from Absolute Zero To Hero when looking at the charts and Trading you can check out my YouTube Channel Frankie candles where I have a Plethora of free content that shows you How to go from absolute zero to fully Understanding how to read a chart and Understanding multiple different trading Strategies to help you become a Profitable Trader whether the price of Bitcoin is going up or down I also offer A free Discord Link in the description Where we have a super active community Of great traders who share their ideas Share their charts and all help each Other grow into more profitable Traders And I also share my sauce in there as Well so definitely check that out and Don't forget the links to bit lab Academy my free Discord and all of these Other resources will be in the Description down below but like I said Today we're going to be going over a
Super simple strategy that can help you Find really really profitable trades and That setup is gonna be divergences now Basically all a Divergence is is when You have price Action Moving in the Opposite direction of an indicator and With divergences you're usually going to Be looking at a momentum indicator you Can look at things like the RSI the Stochastic RSI the macd and many others You can even use third-party indicators That you might like to find divergences As well now when it comes to divergences There are two main types there are Bullish and bearish divergences now you Also have hidden and regular divergences But for this video we're only going to Be looking at regular divergences so so I'm gonna pull up a graphic that shows You an example of what bullish and Bearish divergences are in short of Bullish Divergence occurs when price is Making lower lows and your momentum Oscillator is making higher lows and This is going to make a lot more sense When we actually take a look at the Charts but for bearish divergences You're actually going to be looking at The exact opposite and You're Gonna Wanna See price making higher highs with Your momentum oscillator making lower Highs basically what this is saying is That price is going for this example Will say to the upside all Divergence
Means is that price is moving up but Momentum is coming down basically saying That this move is not going to be Sustainable and price is hitting a wall And it is likely for it to reverse in The opposite direction so without Further Ado let's go ahead and jump into The charts I'm going to show you guys Some examples of divergences that have Actually popped up recently that we were Able to take advantage of in my Discord And the writing was on the wall with This Divergence we were able to see it From a mile away and it actually wound Up playing out in a really big way so Let's go ahead and jump into the charts So I can show you guys a few different Examples of each type of Divergence so Guys here we are on the weekly time Frame and for our first example I want To show you guys an example of a bearish Divergence now we're on the weekly time Frame so this is a pretty high time Frame and when you're looking at Something like the weekly it's gonna Take quite a bit of time for the setup To play out but you can spot divergences On any time frame but just understand This goes back to the basics of TA or Just the basics of reading a chart the Lower the time frame the smaller the Move and the higher the time frame the Bigger the move and this is going to go Back to just basic ta and basic chart
Understanding the lower time frames will Play out quicker but they will be much Smaller moves and on the higher time Frames it's going to take a lot of time For the setup to play out but you're Gonna get a much more drastic move so on The weekly it's gonna take some time to Play out but it's gonna be a big move as You're gonna see here in just a second This High k came in on April of 2021 Before we actually came down for a Correction and came back up to put in a Higher high in November of 2021 so There's our higher high so for a bearish Divergence we're looking for higher Highs on our price and we're going to be Looking for lower highs on our indicator So in this case we're going to be using The relative strength index or the RSI And you can see right here obviously as We just went over we do actually have Higher highs right we got a high and a Higher high pretty self-explanatory now What we're looking for for a bearish Divergence is the lower highs on your Indicator and you can see right here That if we come all the way to our first Top and come straight down to our Oscillator you're going to want to start Your trend line here and you're going to Come to your second top and come Straight down and line it up with your Second top now I'm going to extend this Trend line just a little bit to make it
A little cleaner but you can see that we Have higher highs on our price with our Lower highs on our oscillator and I'm Actually just going to extend this to Make it a little more obvious as well so With a bearish Divergence you're looking For your higher highs and your lower Highs and it makes that alligator mouth Looking formation which is indicating That price is likely going to correct to The downside it's showing that price Wants to go higher but the momentum is Dying off showing that price is Basically coming to a brick wall and Wants to go ahead and correct to the Downside and if you were able to spot This Divergence on the weekly time frame You would have put a lot of weight on This because it's on the weekly time Frame you know if it plays out it's Probably going to play out in a big way And we'll just say you caught the top of This candle and let's say you wrote it All the way down you could have wrote This down for about 76 essentially this Bearish Divergence was calling the Beginning of the bear market and it was Clear as day this is one of the most Obvious bearish divergences you can find On any chart I do just want to show you Guys one more example of a bearish Divergence and if you saw this bear Divergence you also would have caught a Very very big move to the downside that
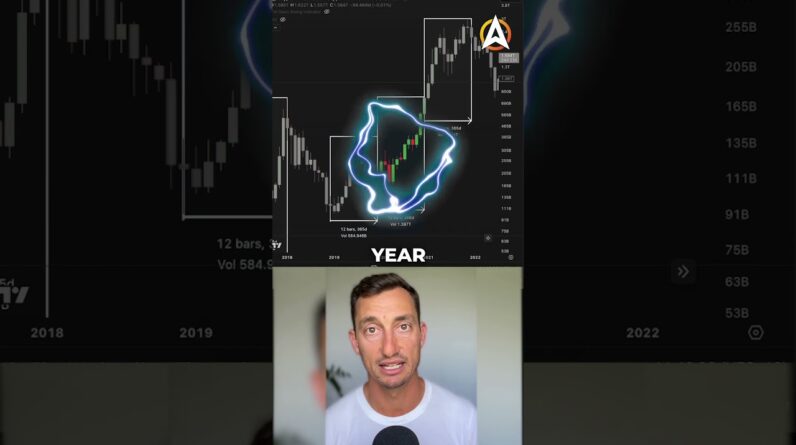
You could have made a lot of money off Of so I'm actually over here on the 12 Hour chart and what we're looking at Here this crash is actually the crash of March 2020. I think we all know what was Happening then uh but you would have Been able to spot this crash if you knew To look for the Divergence and if you Stare at the charts enough you Definitely would have seen this and you Could have made a whole lot of money but Same thing as we were just looking at on The weekly guys if you come right here We actually have a higher high and we Actually have many higher highs uh but Right here is actually where the Divergence occurred you have a high a Higher high and then you come down to Your RSI and you have a high and a lower High again giving you that alligator Mouth letting you know that hey price is Going up but momentum is coming down and It might be a good idea if you're in a Long to take profit or if you're looking To short it might be a good opportunity To get into a short position and if you Saw that you would have been able to Catch the entire March 2020 crash which Did bring us down about 63 percent so These are pretty high time frames that's Why the percentages are so big Um but another thing to notice here on This Divergence is if you got in about Here you would have made about 63 but it
Also would have taken about a month to Play out so you would have been in that Trade for about a month and if we go Back to the weekly Divergence that we Saw that basically started this bear Market you could see if you got in up Here you would have actually been in the Trade all the way if you were still Holding it you would have been in this Trade for over a year but you would have Made 74 so that's that's a huge return Right if you're shorting the market uh But you're gonna have to sit in that Trade and hold out right so I just kind Of wanted to show you guys that you know The higher up you go in the time frames Typically the longer it takes for the Trade to play out but the bigger Percentage move you'll get so those are Two pretty clear examples of a bearish Divergence now I want to bring you guys Over really quick to my premium Discord And this is a setup that we put in here Recently and we were noticing that we Were getting higher highs on our price Action as we were coming up to key Levels of resistance with lower highs on Our oscillator giving us that open Alligator mouth letting us know that hey Price is moving up probably gonna hit a Brick wall and you are likely to correct To the downside so as soon as we call This out to our Discord you come back to Our chart and this is actually what we
Were looking at here we had a big higher High on our price with our lower highs On our momentum waves and look how well This played out we immediately flipped Around and came to the downside and We've nailed that for about eight Percent right even without leverage you Can make a decent bit of gains there Depending on how big your bag is but if You can use leverage to your advantage In a responsible way please be careful With leverage but uh if you can use it Responsibly like we do on my channel Frankie candles uh you can make some Serious serious gains off these Divergences especially this four hour Bearish Divergence that we saw right Here now I do want to actually show you Some exam samples of bullish divergences Before I wrap up this video so I'm Actually going to zoom in here on the Four hour and I did actually just spot a Divergence right here and we did get a Move to the upside so you can see that We do actually have lower lows here we Have a low and a lower low and if you Come down to your indicator you can see We have a low and a higher low now for The bullish divergences remember you're Looking for the opposite of the bearish Divergences so we have our lower lows And our higher lows giving us the Opposite of an alligator mouth and we're Getting like a pinch point is what I
Like to call it you get that little Pinch Point like this and that is Indicating a bullish Divergence and you Can see right there if you were able to Catch this bullish Divergence that Popped up on the four hour you could Have caught the bottom of this move you Would have immediately come up for a Nice seven percent move before a small Retrace but eventually you are starting This whole uptrend which wound up being About 17 and you can make a serious Serious bag off of that move and it's All thanks to that bullish Divergence Letting you know that there's a little Bit of a Divergence between the price And the and the oscillator letting you Know price is coming down but momentum Is coming up this can't be sustained Over time and you're likely to change The trend and go to the upside which is Exactly what happened you could have Caught an awesome 17 move just off of Looking at the Divergence now when you Start combining these divergences with Things like key levels of support and Resistance volume profile and other Indicators to add confirmation it can Make for some seriously confident trades So you're not getting into your trade Being all nervous is it gonna play out Should I pull out what should I do I'm Nervous it takes the emotions out the More confirmations you can get and when
You combine this strategy with key Levels you can see this bullish Divergence that we had with our lower Lows and our higher lows we were also Coming down to a key level of support Letting us know that it was likely we Were going to bounce there anyway and Then you get the confirmation of that Bullish Divergence as well as whatever Comp informations you're looking for and You can see here we also came up to this Macro value Area High When we were putting in this bearish Divergence letting us know this is a key Level we're probably going to reject Here no matter what and now that you see That bearish Divergence forming you get A really really big boost in confidence To actually take that trade and hold it And if you guys are interested in how to Find these key levels and how to use Divergences more in depth in an actual Trading strategy definitely check out my YouTube channel Frankie candles we go Live every single weekday at 5 45 PM Eastern Standard Time and we do ta for Two straight hours where I where I teach My audience how to find stuff just like This so you can also become a profitable Trader and guys also just to bring this To your attention we also did just roll Out the bit lab trading Suite which is Bitlab Academy's custom indicator Suite In that trading stack we actually have
Something called bitlab Market Intelligence and if you turn that on you Can see that this indicator actually Automatically calls divergences for you So you don't even need to draw your Lines or find the higher highs this Indicator will actually just call it for You and you can see right here it was Saying hey you got a stochastic bearish Divergence here might be time to start Turning around and it actually almost Called the exact top here missed it by Candle but no indicator is perfect this Is a beautiful beautiful signal and the One thing I absolutely love about this Indicator is it actually tells you what Indicators you're getting divergences on As well as how many divergences there Are so you could kind of know you could See right here we have one we have a we Have one mfi bearish Divergence and it Didn't really play out that much but When you come up here you see we have a Macd histogram RSI and momentum Divergence and that actually played out In a very very big way this also helps You kind of find out where the strong Divergences are and where the false Signals might pop up so super super Useful indicator if you don't want to Find these manually but you can totally Find these with free indicators on Tradingview it just takes a little bit Of extra work to actually spot them and
Confirm them so guys I think that's all I got for this video just wanted to give You guys a little bit of an intro to Divergences because this is one of the Easiest things to spot on a chart and They also have a very very high hit rate Nothing is a hundred percent sometimes Divergences just don't play out nothing In trading is 100 it's a game of Probabilities that's why you want to Incorporate multiple indicators or other Things such as key levels of support and Resistance volume profiles so on and so Forth and again if you guys are Interested in learning more about this My YouTube channel Frankie candles has a Plethora of free content and again we go Live every single weekday where I show You guys how to become profitable Traders whether the price is going up or Down and with all that being said I'll See you guys in the next one Frankie Candles out [Music] Thank you [Music]