🏆 Free Crypto & Economic Report Emailed To You!
📈 TIA Gann Swing Indicator
🔐 Crypto Storage LEDGER
▶ Subscribe to the channel for more macro market analysis on Bitcoin, Crypto, Stock Markets and Real Estate Cycles.
Subscribe to Michael’s Channel
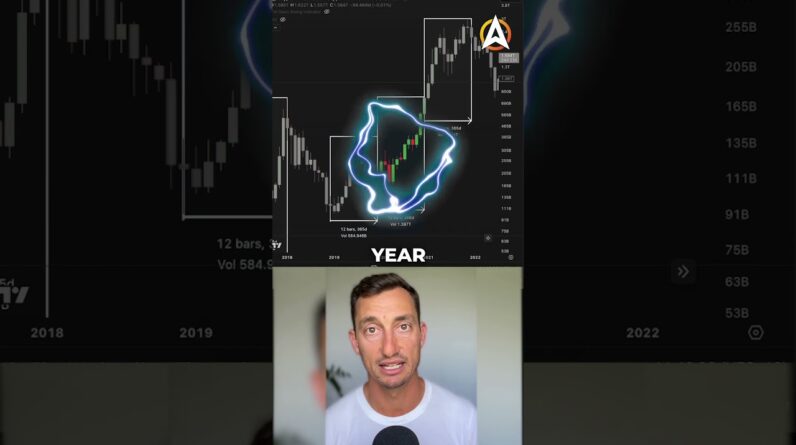
The Daily Golden Cross and Weekly Death Cross on the Moving Averages are a hot topics atm in the Bitcoin and crypto world. Let’s break down what this means to the investor and where and why traders are selling before a potential big move on Bitcoin.
UP TO $48,755 FREE! Crypto Exchanges
🥇 ByBit Free $30,030 + 0% Maker Fees (NO-KYC)
🥈 Bitget Free $8,725 (US + Global Users NO-KYC)
🥉 OKX Bonuses $10,000 (US + Global Users No-KYC)
🇦🇺 Swyftx, Best Australian Crypto Exchange
▶ My Official Socials ◀
YouTube
Instagram
Twitter
▶ My Must-Have Crypto Resources ◀
Education – TIA PREMIUM MEMBERS, Trading Courses & Exclusive Community
Charting – TRADINGVIEW ($30 Off)
Storage – LEDGER
Tax – KOINLY (20% Off)
Trading – TIA GANN SWING INDICATOR
This video is for entertainment purposes only. It is not financial advice and is not an endorsement of any provider, product or service. All trading involves risk. Links above include affiliate commission or referrals. I’m part of an affiliate network and I receive compensation from partnering websites. #crypto #bitcoin #cryptonews
Stock markets around the world have Closed above key resistance levels at The end of their week sessions with even The UK Market hitting new all-time highs This week so how is this bull trap Narrative continuing on in the markets Let's take a look at some of the data Showing how this could be turning where Those traps are involved and also more Data on the presidential cycle which We'll get to in today's video now at the End of the week we've all got places to Be so let's crack on with the video Straight after you hit the like button Subscribe Bell notification icon and Also check out the links in the top of The video description our free crypto And economic report is coming out to you This week your home of macro cycle and Analysis across cryptocurrencies the Stock markets Commodities and of course The biggest of them all the real estate Cycle last your links here are of course Our Channel sponsors buy bit bitget and Swiftx huge sign up bonuses still going On with these exchanges and even having Some a free spot trading fees so no fees When you trade on these particular Exchanges go and check out the details Down Below guys let's crack straight on With it let's first look at what's Happening with the markets around the World coming into next week what we can Expect now the main thing here on Forex
Factory which we like to look at to Determine whether we're going to see any Sort of volatility this is where the Narrative is moving in the news we have CPI reading coming out next week so this Is Tuesday night our time here in Australia and of course uh Tuesday Morning in the US or should I say Tuesday okay so s p i we got the core Inflation data coming out this Essentially is just letting us know that We will probably see some volatility in The market so sharp moves up and down on A short term time frame very short term Time frame probably on the minutes maybe Up to the hourly charts it's important To keep track of what's going on here so That we can understand if we are seeing Some short-term volatility why why that Is happening it's because some major News headlines are coming out otherwise The trend is your friend and at the Moment the trend is up these markets Have been closing above key resistance Levels for the third straight week now We can see the first week was January 23rd the beginning of January 23rd then Last week and now this week as well even Though it was a red week meaning we Closed lower than last week we're still Above the previous low of last week and Still just below the previous high so Basically what gam would call an inside Week now why we're here we want to look
At how this bull trap is continuing on In the market basically that narrative Even though we're starting to see some Consistency with closing above these Higher levels now remember where we are Just looking at the data in these Markets and then I'll give you my Opinion at the end if you've been Following which of course I believe you Should be we also have a more larger Time frame roadmap that we are focusing On as well we've been watching these Markets come up we have talked about the Lows coming in in June and October Across the stock markets and Bitcoin and We are anticipating on a more Medium-term time frame a pullback into February or March okay so we're looking Around that time frame that takes weeks To play out but for now we're seeing a Bit of a pause after in some cases five Six seven weeks up from those December Lows So eventually these markets have to Hold uh pause get some time to breathe Maybe correct a little or maybe just Hold out these levels before the move Continues so that's really important to Understand where we currently sit in These markets especially as we start to Look at some of the other data that is Also coming in here as well now just Going back to the current narrative Before we get on to the bull trap Narrative because they all play in
Together and the other piece of news That continues to come in is any time we See the the FED talking this or also Tries to spin the narrative up when all We have to do is just look at the chart But essentially the other narrative that Is here is of course the tech layoffs And why the media believes which then The everyday retail believes and then Also some of the the big money or the Smart money out there they also believe That the markets have to collapse but we Are looking like we're beginning to turn A corner we'll get to that in the s p And Bitcoin as well But the layoffs that we've seen across The U.S just to bring some of the Numbers into perspective because I want To look at this as objectively as Possible before I give you my opinion We've seen layoffs in the last month of January a around 113 000 there's been you know consistent Layoffs across the year of 2022 and of Course then we start to see the Market's Term well this is the NASDAQ this is the Tech layoffs okay so there is a lot of Fear around Tech being laid off that's Going to lead to a collapse and the Markets are going to continue down Further just like what we saw in 2001 into 2002. now I want to just note the data Here two million people were laid off in
2001 compared to what we are currently Seeing with last year last month being 96 000 or around a hundred and ten Thousand add up for the total of the Year I think you barely hit 200 000 so One tenth of what was happening in two Thousand one and remember back in 2001 The NASDAQ was also much much smaller so There was less people in that sector Less people that have been trained up so 2 million was a much bigger percentage Of the overall Market itself so now we Have less people being laid off one Tenth of what would happen back there And the market is essentially tripled The size if we just look at the data From the peak being around 4 800 to 1200 Points so double double and a half to The peak obviously closer to that triple As well so just trying to put the Numbers into perspective it is far less Than what was going on back then however As you can expect the news has to pump This up and then really try to Ram home All of these layoffs that are happening Even though when you compare it to 20 Years ago it is a drop in the ocean so Let's go back that's just looking at the Specific data of the layoffs themselves Then the technical data here for for the NASDAQ is that we are closing above the Previous swing tops significant swing Tops here and also the bear market Downtrend and we're still above it on a
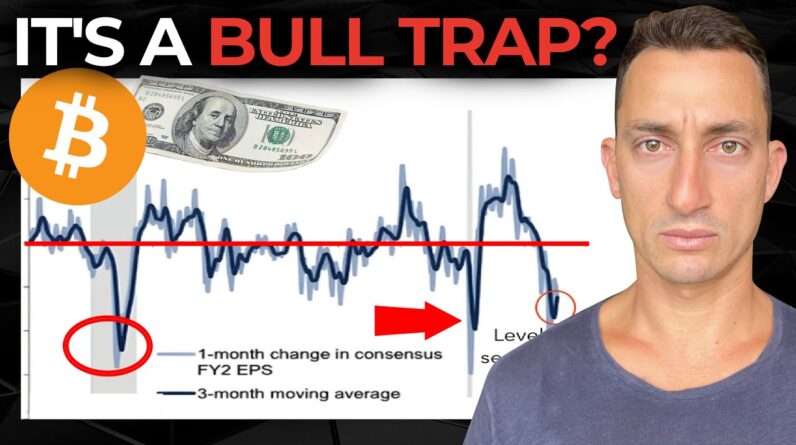
Logarithmic scale as well which is a Harder one to come back to because the Gains need to be more and faster to the Upside than they would be if we're on a Linear chart so it's above both of them At the moment I am anticipating some Sort of pause or a bit of a roll over Here for for the NASDAQ as well because I've had some significant gains over This particular period here with a with A higher low coming in as well this Chart from Goldman Sachs is looking at Investor sentiment around earnings and It is deteriorating or at least it has Been deteriorating it looks like it's Turning the corner here bouncing from The lows lows that we have seen during The pandemic crash and the GFC which was 2008 2009 so these low levels of Investor sentiment around earnings Basically not feeling the greatest not Feel feeling too positive feeling very Negative around earnings looks like it's Bottomed and is now turning a corner This sentiment reading has picked each Of those significant crashes in the Market over the last 15 years basically The two largest crashes that we've seen Since 2008 that was the bottom there 2008 2009 looking at this dark line of Three-month moving average looking at it Again in 2020 and then after those Bottoms basically skyrocketed on each of Those occasions now of course I'm not
Saying that we have to Skyrocket like we Did last time it wouldn't surprise this Chart anyway you know the data here even If we started to crawl our way higher Making higher lows and breaking back Above that's also acceptable but Potentially we are turning the corner Here investors have felt the worst They've felt around earnings and we've Seen those earnings come out from the US Companies US tech us you know S P 500 And they've been bad yet the prices on The stock markets have gone up the Reason for that is if you're following My Twitter U.S earnings season is a Report of past performance so they Report to us what's happened the three Months prior stock markets are Forward Thinking and acting we don't act on old News or at least I hope we're not acting On old news we're trying to piece Together what's coming up for us next And then place our bets or in this case Our trades on what we think is going to Happen next that's why it doesn't matter About these earning Seasons it's Absolute waste of time trying to say Well these companies these tech stocks Have had bad earnings all year yet the Market is bouncing from this point it Makes no sense when Market stock markets Are forward thinking you're always Trying to anticipate what is going to be The next latest Trend and the biggest
Thing to boom and bust if you hear from All coins in crypto of course that's What we do all the time we're like What's going to be the next narrative What's going to pop off this is going to Be the next greatest thing why go and do The opposite when it comes to the stock Market it makes no sense all of these Markets are Forward Thinking don't worry About these potential past performance Of their earnings in this case Essentially the market is anticipating That earnings have bottomed and will Turn the corner in 2023. now to the s p And we have just closed another wig very Close to the previous swing top here set Back in mid-December and the last two Weeks have actually been rejected off The 50 level so that key 50 level of the Bear market decline this is what we're Looking at here from the peak to the Trough and then splitting this in half Right down the guts is 41.55 so that is Still playing out as a key level Technically speaking for the S P 500 you Can see that we've had a bottom at this Level and that bottom came in before the Bottom uh the final bottom came in so That's pretty interesting to note that We're seeing a balancing act here Happening at that 50 level now there was Also a top here in May and now the Market is starting to find some Resistance here over the last two weeks
At this level so for the Bulls we just Want to see a bit of a pause here or a Pullback of sorts nothing too severe and Then the bust Above This level for the Bears obviously want to see it rejected Pretty hard and break this December low That breaker that assemble low is not Good for the Bulls at all of course but Really it changes the the structure at Least in the intermediate term because If we do start to fall under this level And get trapped between 3 500 and around 3 800 that means it's just going to be a Longer slower grind for 2023 so for the Bears that's exactly what you want to See in order to at least hopefully test That downside of 3500 and get to a lower Price for the Bulls you definitely want To see around 3 800 being held up if This is the decline of course and then In Quarter Two we start to break higher Now the last bull scenario is of course We just hold out at these levels and Then quite quickly we start to break Higher and then consolidate Above This Level of 41.55 so there's obviously a Few scenarios the up down sideways type Scenario but again this is investing and You've got to be prepared prepared for All sides of the market you don't go Into a sporting event or any sort of War Only looking at one side of the market They're the fools they're basically the Guys who only read the titles of YouTube
Videos you see them in the comments Section thank you to you guys for Watching to the end of yesterday's video And commenting ball trap all all the way Down the comments section that got a few People fooled as they were only reading The title and then the comments now of Course I don't want to fool people but I Do want people to watch the videos and Look at the data that's coming out Because there is a lot of key data here That shows what 2023 may be I guess the Probabilities of what 2023 could turn Into compared to what the news is Telling us and I guess what a lot of People are hoping for because they've Missed out on bull runs before they're Hoping for much lower prices because Everything is too expensive I agree Everything is quite expensive but we're Starting to see a trend of some of these Things coming down at least in the short Term now just because I think they're Expensive doesn't mean they're going to Come down I've got to keep playing with What the market is giving me and at the Moment the data around the third year of The presidential cycle is that we're Probably going to see higher prices or At least hold up at these prices in 22 23 essentially the year of 2023 not Being a negative year like we like what We saw in 2022 this is some of the data Here sourced from fact set Global
Financial data you can see some of the Dates here as well as of May 17th of 2022 so history favors a positive 2023. What is the presidential cycle Essentially there's four years for a U.S Presidency the fourth year is the year Of the election so that is next year in 2024 we are in the third year of that Cycle this is the data from the third Year frequency of positive returns U.S President's third year nine out of ten Third year or third year of the cycle Nine out of ten of those have been a Positive return year okay frequency of Two consecutive down years Seven percent so we've had one down here So that was last year For another down year to occur it's only Seven percent chance of that happening So what sort of returns can we look out For in 2023 so if CPI has peaked greater Than five percent generally we see about A 12 return on the s p 500. 2023 returns after a negative year so Last year was a negative year we Typically see about a 13 return average 12-month return after U.S midterm year So last year was a midterm year you see About an 18 return average 12-month Return after negative midterm years so Last year was a negative midterm year we See about a 20 and for the last one here I have to get rid of my face average 12 Month returns after bear markets about
49 so that will possibly be from the low Looking at the low uh being in October But nonetheless even if we took some of These lowest percentages here you're Still looking between sort of 10 and 20 Return for 2023 with a possible nine out Of 10 chance of this happening now Remember nothing is perfect here but They're pretty good odds and I don't Really want to bet against these sort of Odds so if we see good odds in the S P 500 and we're starting to see the NASDAQ Bounce as well and that data doesn't Seem as bad and in terms of the body Bottom signal here where we're seeing it Happen this could potentially be the Third time as well what does that mean For Bitcoin well it seems like Bitcoin May have also bottomed in a similar time Period here around that November period And we've obviously bounced away pretty Significantly so it is possible that any Of these sorts of drops are reasonably Good by the dip opportunities that's Something that I've been also mentioning On Twitter so make sure you do go and Follow there the links are in the top of The video description just looking at Bitcoin and uh all-time highs and that Sort of thing so going back to bitcoin Here these are the key levels that I'm Looking out for terms of dips twenty Thousand seven hundred nineteen thousand Eight hundred and then we don't really
Want to see the market go any lower than Around 18 6 and if you really want to Get that far down probably these lows Here at around eighteen thousand dollars If it does go lower than this point the Structure changes and this is no longer A boomer the start of a bull market you Know that first higher swing low we Basically drop back into this zone so The Bears hoping 4 10 12 14 000 Bitcoin Must see the market go under eighteen Thousand dollars if this move doesn't go Under eighteen thousand dollars then We're probably in a good position here To start to accumulate DCA that old BTC For that move up it's my opinion of the Market is that we haven't seen the Structure change yet I'm not Anticipating that the structure will Change but they are my levels in case The structure does change a drop below 18K on bitcoin and for the s p is a Break of that December bottom same sort Of deal for the NASDAQ as well so so far The structure is telling us that it Looks like this is that transitional Period that we've looked at before Basically the market trying to find its Grounding level which has basically been Going on since around May since that Bottom came in in May and so moving Forward from this point I have to play My cards my investment cards as I see The market and in terms of my own
Opinion of the data that I've Extrapolated here and and how I'm Interpreting it is that this is the Start of the next leg up we can be Bullish in the long term but then also Be bearish in the shorter term and That's precisely what's what's happening Right now and so I'm going to use this Opportunity to DCA into some BTC if you Want to learn more about that go and Check out the links in the top of the Video description this is where the last Of the shills come in uh you've got our Tia premium members down here where I Post about my altcoin positions my Bitcoin position my retirement fund Portfolio and we also do crypto trading For cash flow over there as well using Our trading strategies so link to that Is down below along with our Channel Sponsors buy bitbit get swiftex and Don't forget that free economic report Coming out to you guys next week thanks Once again guys hope you have a Fantastic weekend let me know in the Comments section with Emojis what you Plan to get up to this weekend I'm gonna Hit the beach surf spend time with Family and probably barbecue I'll see You guys at the next video Until then Have a great weekend peace out